About Yukon
The Yukon isn’t just a place; it’s a feeling. It’s that sudden rush when you glimpse endless mountains or the way the air smells sharp and clean, like it’s been filtered by glaciers for centuries. If you’re looking for ordinary, you won’t find it here.
I heard about Yukon long before I ever stepped foot there. My grandfather used to tell me about the Klondike Gold Rush, he told me how thousands of dreamers and drifters braved the cold for a chance of getting rich. Most of the people only found hardship instead of gold, but the stories they left behind? Pure treasure.
When I finally visited, I started in Whitehorse. It’s a small city, but there’s nothing sleepy about it. From quirky coffee shops to locals who’ll chat your ear off about the best hiking trails, it’s a place that feels oddly familiar, even if it’s your first time.
Let’s not forget Dawson City. The city is like a stepping into what you usually see in a Western movie, complete with dirt streets and old saloons. I even tried the infamous Sourtoe Cocktail, where you can drink whisky with a real mummified toe in your whisky. Disgusting? Probably, for some people. Memorable? Definitely.
The Yukon wilderness, though-that’s the showstopper. Kluane National Park is home to Mount Logan, Canada’s tallest mountain. Standing there, surrounded by jagged peaks and shimmering glaciers, you realize how small you are. It’s humbling.
But the people here in Yukon are really something else. Hardy, funny, and very welcoming, they embody the spirit of this place. They’ll tell you stories about grizzly encounters or northern lights so bright they lit up the entire sky. And if you’re lucky, they’ll even teach you how to stay warm in -40 degree Celcius. Hint: layers, lots and lots of layers.
Yukon probably isn’t for everyone, but maybe that’s what makes it so special. It’s for those who crave a little adventure and don’t mind a bit of frostbite along the way.
Population Characteristics
According to the latest census, Yukon has a population of around 40,232 people. The territory's population is in increased . Between 2016 and 2021, the population of Yukon has increased by 12.15%.
| Population in 2016 | Population in 2021 | Difference |
|---|---|---|
| 35,874 | 40,232 | +12.15% |
2026 Population Projection
Based on the compound annual growth rate (CAGR) of 2.32% observed between the 2016 and 2021 censuses, Yukon's population is projected to reach approximately 45,119 people by 2026, with a projected population density of around 0.10 people per km².
| Population in 2021 | Projected Population in 2026 | Projected Density in 2026 (per km²) |
|---|---|---|
| 40,232 | 45,119 | 0.10 |
This projection is an estimate calculated by CAPopulation from the compound annual growth rate between the 2016 and 2021 censuses. Official 2026 complete census data expected to be released in late 2027.
Population By Genders
The male population of Yukon is around 20,100 while the female population is around 20,130.
Of the 40,232 total population in Yukon, the largest gender is female with around 20,130 women within the population.
| Male | Female | Difference |
|---|---|---|
| 20,100 | 20,130 | +0.15% |
Is Yukon a Good Place to Live?
Based on 2021 Statistics Canada Census data, here's how Yukon compares across key quality-of-life indicators. Draw your own conclusions from the actual numbers.
Employment & Economy
Income & Affordability
Commute
Housing Character
Household Composition
Source: Statistics Canada, 2021 Census of Population. Provincial comparison isn't shown on province/territory pages themselves.
Population by Age Characteristics
Yukon has a young population. The majority of the population is people aged 35 to 39 years old, accounting for 8.50% of the total population. The territory median age is 39.20.
| Data | Male | Female | Difference | Total |
|---|---|---|---|---|
| 35 to 39 years | 1,660 8.30% | 1,770 8.80% | 6.21% | 3,425 8.50% |
| 30 to 34 years | 1,665 8.30% | 1,750 8.70% | 4.86% | 3,415 8.50% |
| 60 to 64 years | 1,430 7.10% | 1,450 7.20% | 1.38% | 2,880 7.20% |
| 40 to 44 years | 1,365 6.80% | 1,470 7.30% | 7.14% | 2,840 7.10% |
| 55 to 59 years | 1,355 6.70% | 1,440 7.20% | 5.90% | 2,805 7.00% |
| 25 to 29 years | 1,310 6.50% | 1,390 6.90% | 5.76% | 2,705 6.70% |
| 45 to 49 years | 1,215 6.00% | 1,400 7.00% | 13.21% | 2,615 6.50% |
| 50 to 54 years | 1,220 6.10% | 1,235 6.10% | 1.21% | 2,460 6.10% |
| 5 to 9 years | 1,245 6.20% | 1,130 5.60% | 9.24% | 2,375 5.90% |
| 65 to 69 years | 1,225 6.10% | 1,150 5.70% | 6.12% | 2,370 5.90% |
| 10 to 14 years | 1,205 6.00% | 1,065 5.30% | 11.62% | 2,275 5.70% |
| 0 to 4 years | 1,090 5.40% | 1,085 5.40% | 0.46% | 2,175 5.40% |
| 20 to 24 years | 1,080 5.40% | 1,060 5.30% | 1.85% | 2,140 5.30% |
| 15 to 19 years | 1,085 5.40% | 995 4.90% | 8.29% | 2,085 5.20% |
| 70 to 74 years | 925 4.60% | 840 4.20% | 9.19% | 1,765 4.40% |
| 75 to 79 years | 560 2.80% | 460 2.30% | 17.86% | 1,025 2.50% |
| 80 to 84 years | 270 1.30% | 230 1.10% | 14.81% | 505 1.30% |
| 85 years and over | 175 0.90% | 210 1.00% | 16.67% | 385 1.00% |
| 85 to 89 years | 115 0.60% | 140 0.70% | 17.86% | 255 0.60% |
| 90 to 94 years | 50 0.20% | 55 0.30% | 9.09% | 110 0.30% |
| Average age of the population | 40 39.90% | 40 40.00% | 2.50% | 40 39.90% |
Broader Age Groups
If the territory's population is divided into broader age groups, most of the population falls into the 15 to 64 years age group. The group accounts for 68.00% of the population. The other age groups, 0 to 14 years and 65 years and over, account for 17.00% and 15.00%, respectively.
If we look at the population data from the broader age groups, we can see that most people in Yukon are within the 15 to 64 years age group.
| Data | Male | Female | Total |
|---|---|---|---|
| Median age of the population | 39.20% | 39.60% | 39.20% |
| 0 to 14 years | 17.60% | 16.30% | 17.00% |
| 65 years and over | 15.70% | 14.40% | 15.00% |
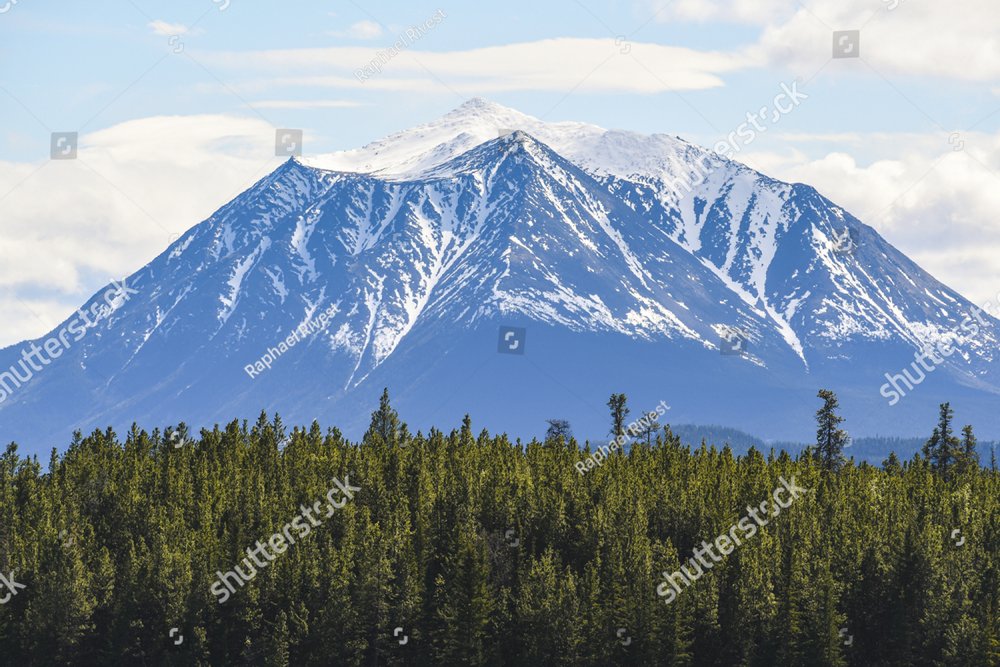
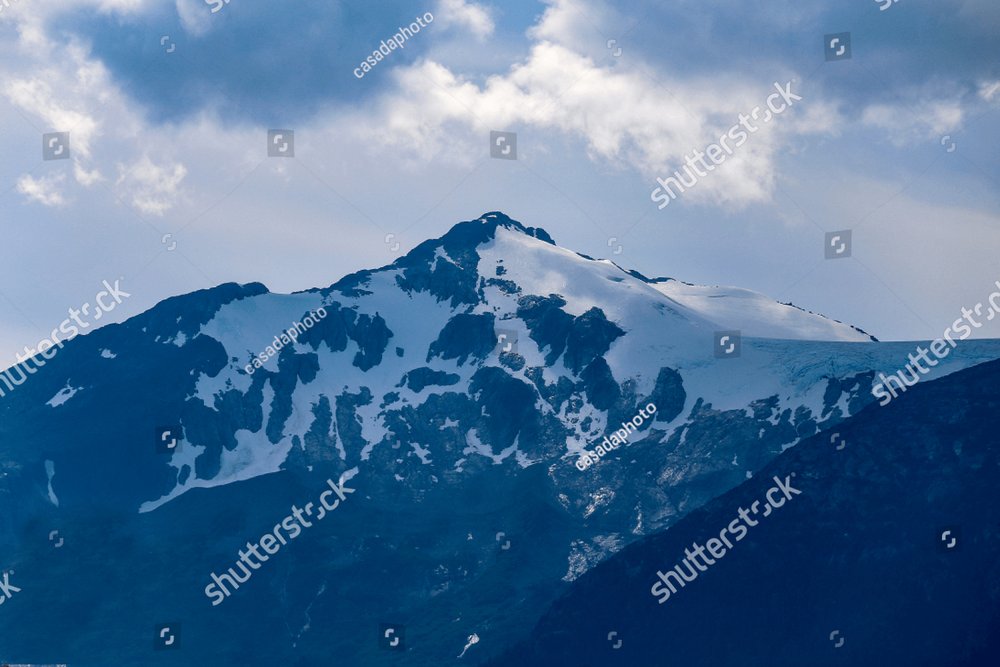
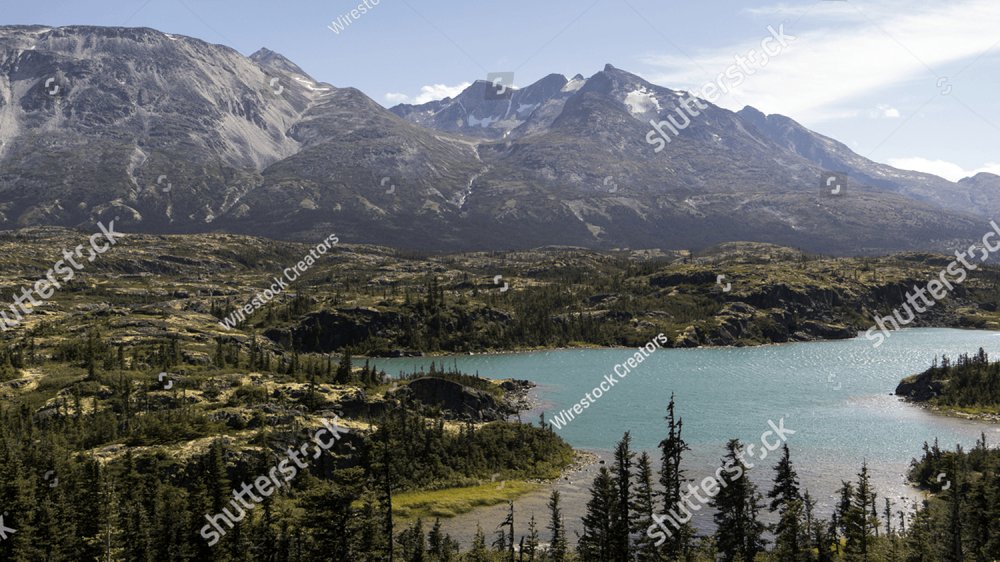
Photos of Places & Sceneries in Yukon


Explore Yukon Through Videos
Population of Yukon by Ethnicity and Origin
The population of Yukon is quite diverse, which contributes to the territory's vibrant cultural landscape. Yukon is inclusive and accepts various ethnic groups with open arms. Furthermore, the province appreciates the unique contributions that each ethnicity brings.
The top 5 ethnicities and origins in the province are English, which accounts for 23.00% of the total population, followed by Scottish (21.16%), Irish (18.79%), German (13.45%), and Canadian (11.82%).
Other ethnicities and origins in Newfoundland and Labrador include French, First Nations (North American Indian), Ukrainian, Dutch, and Filipino.
| Ethnicity and Origin | Male | Female | Percentage in Population |
|---|---|---|---|
| English | 22.09% | 23.91% | 23.00% |
| Scottish | 21.33% | 20.99% | 21.16% |
| Irish | 18.79% | 18.80% | 18.79% |
| German | 13.75% | 13.16% | 13.45% |
| Canadian | 12.20% | 11.45% | 11.82% |
| French | 10.20% | 11.22% | 10.72% |
| First Nations (North American Indian) | 8.72% | 9.18% | 8.96% |
| Ukrainian | 4.67% | 5.28% | 4.99% |
| Dutch | 4.46% | 4.76% | 4.61% |
| Filipino | 3.78% | 5.18% | 4.50% |
Immigration Profile
Immigration patterns vary a great deal from one area to another, which makes this data one of the more distinctive parts of Yukon's population profile.
About 13.6% of Yukon's population are immigrants (5,385 people).
The top countries of origin for Yukon's immigrant population are Philippines (1,405), United States of America (530), United Kingdom (525), Germany (475), India (360).
| Country of Birth | Population |
|---|---|
| Philippines | 1,405 |
| United States of America | 530 |
| United Kingdom | 525 |
| Germany | 475 |
| India | 360 |
Household and Dwelling Characteristics
About 10,355 of Yukon's population live in a single-detached house. In addition, most of them are living in 2 persons household.
Household Size
About 16.90% of the population lives in 2 persons households. 1 person households ranked second, accounting for 16.35% of the population. 3 persons, 4 persons, and 5 or more persons households account for 7.25%, 6.10%, and 3.40%, respectively.
| Number of Person(s) in Household | Total | Percentage |
|---|---|---|
| 2 persons | 5,800 | 16.90% |
| 1 person | 5,615 | 16.35% |
| 3 persons | 2,500 | 7.25% |
| 4 persons | 2,100 | 6.10% |
| 5 or more persons | 1,165 | 3.40% |
Income in Yukon
Analyzing income distribution in Yukon can help us better understand its socioeconomic dynamics.
Per Capita Income
According to 2020 data, the median personal income within Yukon is $54,800.
A region's per capita data sheds light on the average income earned per person living in it. Since per capita income is calculated by dividing the region's total income by its population, it quantifies the population's economic situation on an individual basis.
Such data offers insights into the territory's economic performance, spread of income across individuals, quality of life, as well as disparities within its borders.
Most of Yukon population or around 5,845 people falls in the $50,000 to $79,999 group. The next largest groups are the $10,000 to $29,999, and $100,000 to $149,999 with around 4,290 and 4,095 people, respectively.
Household Income
The Yukon's median household income is $100,000, according to 2020 data.
Above national average Yukon's median household income is 16,000 dollars above the Canadian national median of $84,000 (2020 data, 2021 Census).
The data provides important insights into the territory's economic landscape as well as the living standards of its population.
Analyzing such data enables researchers, policymakers, and businesses to gain a more comprehensive understanding of the territory's income distribution, disparities, and trends.
Education Levels in Yukon
This data sheds light on the distribution of Yukon residents across educational milestones.
Such information is crucial in shaping the province’s policies on education, workforce development strategies, and initiatives that aim to improve access to quality education and promote lifelong learning opportunities.
63.70% or most of the Yukon population has a Postsecondary certificate, diploma or degree. 30.15% of the population has a Bachelor's degree or higher, 24.05% has a High (secondary) school diploma or equivalency certificate, and 12.25% has No certificate, diploma or degree.
| Degree | Men | Women | Total | Percentage |
|---|---|---|---|---|
| Postsecondary certificate, diploma or degree | 15,925 | 19,115 | 35,045 | 63.70% |
| Bachelor's degree or higher | 6,520 | 9,990 | 16,505 | 30.15% |
| High (secondary) school diploma or equivalency certificate | 6,920 | 6,630 | 13,550 | 24.05% |
| No certificate, diploma or degree | 4,290 | 2,795 | 7,090 | 12.25% |
Below national average 30.2% of Yukon's population has a bachelor's degree or higher, compared to the national average of 32.9% (Canada, 2021 Census).
Employment in Yukon
This dataset provides a snapshot of employment trends in Yukon. It encompasses a wide range of sectors, industries, as well as job categories.
The data shows that the unemployment rate in Newfoundland and Labrador is at 4.91% which is pretty low.
| Status | Percentage |
|---|---|
| Employment rate | 66.83% |
| Unemployment rate | 4.91% |
Working as an Employee
The table shows the data on the total number of individuals in the territory who work as an employee. The majority of Yukon's population (around 65.90%) are working permanent position as an employee.
Self-employed
In the territory, there are 1,890 men and 1,305 women working as self-employed individuals, bringing the total number to 3,190.
| Status | Men | Women | Total |
|---|---|---|---|
| Self-employed | 1,890 | 1,305 | 3,190 |
Employment Industry Sectors
The Yukon industry employment sector census data offers insights into the region's economic landscape. The distribution of employment in Yukon is categorized and quantified, which reveals the region's economic composition.
Yukon has a wide range of industries. Most of its population (25%) works in the public administration sector. The Health care and social assistance sector comes second at 12%, followed by Retail trade at 10%.
| Industry | Men | Women | Percentage |
|---|---|---|---|
| Public administration | 2,450 | 3,330 | 25% |
| Health care and social assistance | 570 | 2,180 | 12% |
| Retail trade | 1,260 | 970 | 10% |
| Construction | 1,790 | 255 | 9% |
| Educational services | 490 | 1,240 | 7% |
| Accommodation and food services | 560 | 725 | 6% |
| Professional, scientific and technical services | 655 | 585 | 5% |
| Other services (except public administration) | 440 | 505 | 4% |
| Transportation and warehousing | 590 | 275 | 4% |
| Mining, quarrying, and oil and gas extraction | 495 | 180 | 3% |
| Arts, entertainment and recreation | 280 | 355 | 3% |
| Administrative and support, waste management and remediation services | 410 | 200 | 3% |
| Information and cultural industries | 305 | 245 | 2% |
| Agriculture, forestry, fishing and hunting | 220 | 145 | 2% |
| Finance and insurance | 125 | 195 | 1% |
| Manufacturing | 210 | 90 | 1% |
| Real estate and rental and leasing | 170 | 135 | 1% |
| Wholesale trade | 200 | 90 | 1% |
| Utilities | 165 | 45 | 1% |
| Management of companies and enterprises | 0 | 0 | 0% |
Labour Market Snapshot
A quick snapshot of where Yukon residents work — the leading industry sectors employing them, and the broad occupation categories they work in.
Top employer sectors in Yukon: Public administration (25%), Health care and social assistance (12%), -45 Retail trade (10%)
Top occupation categories in Yukon: Sales and service occupations (20%), Occupations in education, law and social, community and government services (19%), Trades, transport and equipment operators and related occupations (18%)
Places of Work
The data offers insights into the commuting patterns as well as workplace distribution in the territory. It provides a snapshot of workplaces, showing their geographic distribution and the flow of workers across different areas.
| Work Location | Men | Women | Total | Percentage |
|---|---|---|---|---|
| Usual place of work | 7,645 | 9,135 | 16,785 | 76.60% |
| No fixed workplace address | 1,965 | 650 | 2,615 | 11.90% |
| Worked at home | 1,105 | 1,385 | 2,495 | 11.40% |
| Worked outside Canada | 10 | 0 | 15 | 0.10% |
Commuting
The data sheds light on how Yukon residents travel to school or work. It highlights the frequency of different modes of transportation like walking, cycling, carpooling, and public transit.
The data is pivotal in the making of transportation policies as well as the development of transit systems. Ultimately commuting data contributes to improving the quality of life of Yukon residents and sustainable urban planning.
Commuting Duration
This data reveals the average time that the residents of Yukon spend traveling to their workplaces. It also sheds light on the efficiency of the territory's public transit systems, and road networks, as well as the accessibility of the territory.
| Duration | Percentage |
|---|---|
| Less than 15 minutes | 51.70% |
| 15 to 29 minutes | 37.00% |
| 30 to 44 minutes | 6.60% |
| 60 minutes and over | 2.50% |
| 45 to 59 minutes | 2.20% |
Marital Status
The statistics on marital status in Yukonshed light on its societal dynamics. It captures the diverse types of marital statuses of the population.
Long-term commitments, such as common-law partnerships, civil unions, and marriages, reflect the territory's social fabric. We can gain insights into Yukon's changing preferences and norms by examining the trends in marital status.
Language Spoken
The data below highlights territory's linguistic diversity, showing elegances of solo language as well as bilingual harmonies. Other than language, it also shows the cultural landscape in Canada.
English is the most spoken official language in Yukon. About 37,720 people living in the province speak English, 1,810 people speak French, 170 people speak English and French language, and 140 people speak Neither English nor French language.
| Language | Population |
|---|---|
| English | 37,720 |
| French | 1,810 |
| English and French | 170 |
| Neither English nor French | 140 |
Mother Tongue & Home Language
Useful for newcomers researching an area: this shows the language residents first learned at home in childhood (mother tongue) and the language they speak most often at home now, which can differ as families settle in.
| Language | Mother Tongue | Spoken Most Often at Home |
|---|---|---|
| English | 80.3% | 89.6% |
| Non-official languages | 11.8% | 5.6% |
| French | 4.5% | 2.6% |
Religion
Yukon is predominantly Christian. About 13,860 of its population is Christian (6,425 males and 6,425 females).
The second largest religion in the province is Sikh with 1.0% of the population adhering to the religion. There are also Hindu and Buddhist, both represent 0.7% and 0.7% of the population, while Muslim represent 0.5% of the population.
| Religion | Population |
|---|---|
| Christian | 35.0% |
| Sikh | 1.0% |
| Hindu | 0.7% |
| Buddhist | 0.7% |
| Islam | 0.5% |
| Jewish | 0.2% |
Cities in Yukon
Towns in Yukon
Villages in Yukon
Frequently Asked Questions about Yukon
According to the 2021 census, Yukon has a population of approximately 40,232 people.
Between 2016 and 2021, the population of Yukon increased by 12.15%.
Yukon has a population density of approximately 0.10 people per square kilometre.
Yukon covers a land area of approximately 472,345.44 km².
The median age of the population in Yukon is 39.20 years.
The largest ethnic or cultural origin group in Yukon is English.
The median household income in Yukon is $100,000, based on 2020 data.
English is the most common first official language spoken in Yukon.
Christian is the predominant religion in Yukon.
Statistics Canada (statcan.gc.ca) conducted the 2026 Census of Population in May 2026. However, census data goes through an extensive processing, validation, and quality-assurance period before public release. Based on the release plan, the 2026 Census results begin rolling out on February 10, 2027, with complete community-level profiles available by December 1, 2027. Until then, this page uses 2021 Census data as its primary source, supplemented by a population projection estimate for 2026 calculated using the compound annual growth rate (CAGR) from the 2016–2021 Census period.