Nunavut — Population & Demographics (2026)
Data source: Statistics Canada, 2021 Census of Population — View the official Nunavut census dataset on Statistics Canada
- Population (2021)
- 36,858
- +2.5% since 2016
- Density
- 0.0
- people per km²
- Land area
- 1,836,994
- km²
- Median age
- 25.6
- years
- Median household income
- $118,000
- 2020, before tax
- Unemployment rate
- 16.9%
- 2021 Census
This article shows the demographic data and statistics of Nunavut. It is a territory in Canada that encompasses a land area of 1,836,993.78 km2. The territory has a population density of 0.00 people per km2.
We highlight the Nunavut territory's various population characteristics. From gender, age distribution, ethnicity, household and dwelling, and income to spoken languages, occupation, and religion.
Nunavut on the Map
Nunavut location on the map. View in Google Maps
About Nunavut
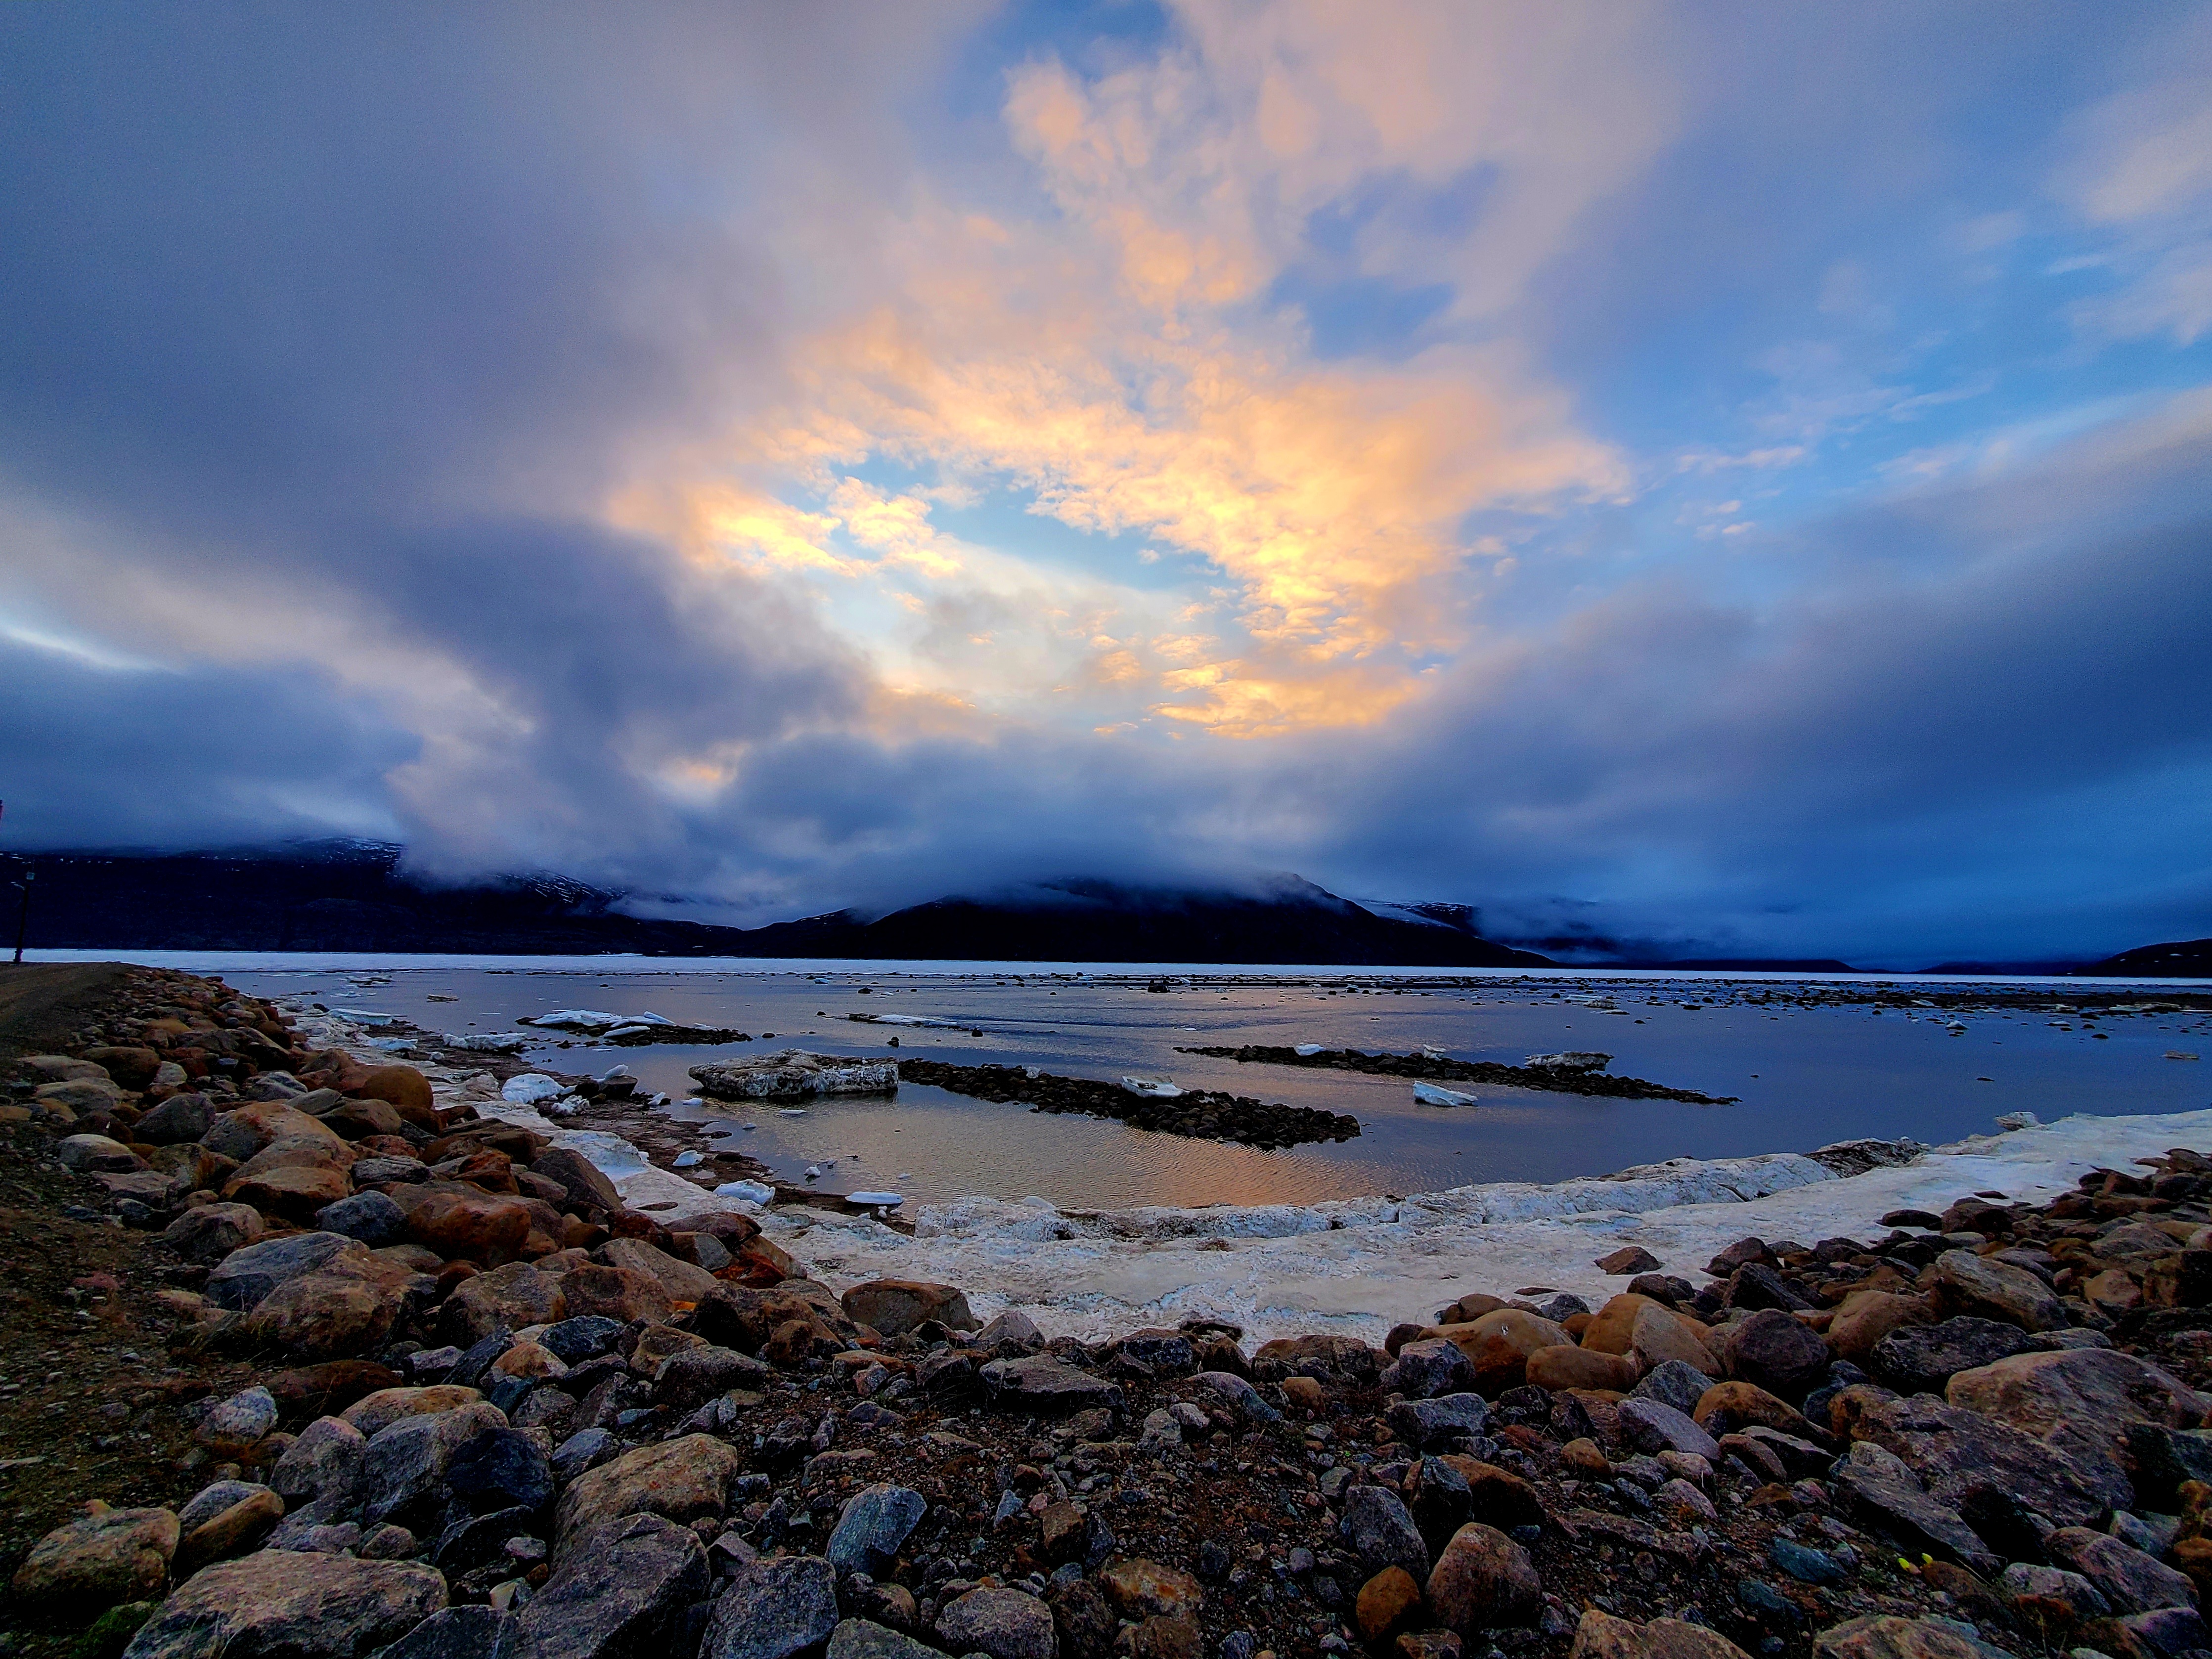
Let’s talk about Nunavut. It’s not the kind of place that whispers-it roars. The vastness of the land, the brilliance of the snow, and the biting chill of the Arctic air hit you all at once. If you’ve never been there, you might think, “What’s even up there?” Answer: everything you didn’t know you needed to see.
Years ago, I met someone from Iqaluit, the capital. She told me about a place where the sun doesn’t set for weeks in summer and disappears entirely in the heart of winter. Can you imagine trying to sleep with the midnight sun glaring in your window or surviving the deep cold when darkness stretches on for months? It’s a lifestyle most of us can’t wrap our heads around, but for Nunavummiut, it’s just life.
The people here have stories carved into the ice and the tundra. The Inuit culture is alive, vibrant, and deeply tied to the land. From throat singing that sends chills down your spine to carvings that tell tales older than most nations, it’s a reminder that this isn’t just a cold place-it’s a rich one.
And then there’s the wildlife in Nuvanut. Polar bears, Narwhals, and Arctic foxes roam freely like pigeons do in other parts of the country. Once, someone told me they spotted a walrus lounging near a dock, like it had clocked out early and was ready for a beer. True or not, I love the image.
Nunavut’s modern challenges are real-housing, infrastructure, food security. But the spirit of the people here? Unbreakable. Whether it’s kids playing hockey on a frozen bay or elders teaching traditional hunting methods, life in Nunavut feels like a balance of old and new.
And the aurora borealis? You haven’t really lived until you’ve seen green, pink, and purple light dancing across a pitch-black sky.
Population Characteristics
According to the latest census, Nunavut has a population of around 36,858 people. The territory's population is in increased. Between 2016 and 2021, the population of Nunavut has increased by ▲ 2.54%.
| Population in 2016 | Population in 2021 | Difference |
|---|---|---|
| 35,944 | 36,858 | +2.54% |
2026 Population Projection
Based on the compound annual growth rate (CAGR) of 0.50% observed between the 2016 and 2021 censuses, Nunavut's population is projected to reach approximately 37,795 people by 2026, with a projected population density of around 0.02 people per km².
| Population in 2021 | Projected Population in 2026 | Projected Density in 2026 (per km²) |
|---|---|---|
| 36,858 | 37,795 | 0.02 |
This projection is an estimate calculated by CAPopulation from the compound annual growth rate between the 2016 and 2021 censuses. Official 2026 complete census data expected to be released in late 2027.
Nunavut Population Trend & Context
Nunavut is the 13th-largest territory in Canada, with a 2021 census population of 36,858 — an increase of 914 (▲ 2.54%) people from the 35,944 recorded in 2016.
The territory's population has grown slightly over this period. The territory's median age of 25.6 years — below the national median of 41.9 — suggests a younger, potentially growing population.
Population By Genders
The male population of Nunavut is around 18,770 while the female population is around 18,090.
Of the 36,858 total population in Nunavut, the largest gender is male with around 18,770 male within the population.
| Male | Female | Difference |
|---|---|---|
| 18,770 | 18,090 | +3.62% |
Is Nunavut a Good Place to Live?
Based on 2021 Statistics Canada Census data, here's how Nunavut compares across key quality-of-life indicators. Draw your own conclusions from the actual numbers.
Employment & Economy
Income & Affordability
Commute
Housing Character
Household Composition
Source: Statistics Canada, 2021 Census of Population. Provincial comparison isn't shown on province/territory pages themselves.
Population by Age Characteristics
Nunavut has a young population. The majority of the population is people aged 0 to 4 years old, accounting for 11.90% of the total population. The territory median age is 25.60.
| Data | Male | Female | Difference | Total |
|---|---|---|---|---|
| 0 to 4 years | 2,295 12.20% | 2,085 11.50% | 9.15% | 4,385 11.90% |
| 5 to 9 years | 2,030 10.80% | 1,965 10.90% | 3.20% | 3,990 10.80% |
| 10 to 14 years | 1,850 9.90% | 1,850 10.20% | 0.00% | 3,705 10.10% |
| 15 to 19 years | 1,535 8.20% | 1,550 8.60% | 0.97% | 3,085 8.40% |
| 30 to 34 years | 1,555 8.30% | 1,485 8.20% | 4.50% | 3,040 8.20% |
| 25 to 29 years | 1,470 7.80% | 1,520 8.40% | 3.29% | 2,990 8.10% |
| 20 to 24 years | 1,475 7.90% | 1,385 7.70% | 6.10% | 2,860 7.80% |
| 35 to 39 years | 1,195 6.40% | 1,175 6.50% | 1.67% | 2,370 6.40% |
| 40 to 44 years | 1,085 5.80% | 1,025 5.70% | 5.53% | 2,110 5.70% |
| 50 to 54 years | 995 5.30% | 990 5.50% | 0.50% | 1,985 5.40% |
| 45 to 49 years | 965 5.10% | 960 5.30% | 0.52% | 1,930 5.20% |
| 55 to 59 years | 840 4.50% | 770 4.30% | 8.33% | 1,615 4.40% |
| 60 to 64 years | 625 3.30% | 565 3.10% | 9.60% | 1,190 3.20% |
| 65 to 69 years | 395 2.10% | 325 1.80% | 17.72% | 720 2.00% |
| 70 to 74 years | 260 1.40% | 225 1.20% | 13.46% | 485 1.30% |
| 75 to 79 years | 115 0.60% | 105 0.60% | 8.70% | 220 0.60% |
| 80 to 84 years | 50 0.30% | 50 0.30% | 0.00% | 105 0.30% |
Broader Age Groups
If the territory's population is divided into broader age groups, most of the population falls into the 15 to 64 years age group. The group accounts for 62.90% of the population. The other age groups, 0 to 14 years and 65 years and over, account for 32.80% and 4.40%, respectively.
If we look at the population data from the broader age groups, we can see that most people in Nunavut are within the 15 to 64 years age group.
| Data | Male | Female | Total |
|---|---|---|---|
| 15 to 64 years | 62.50% | 63.20% | 62.90% |
| 0 to 14 years | 32.90% | 32.60% | 32.80% |
| 65 years and over | 4.60% | 4.20% | 4.40% |


Explore Nunavut Through Videos
Population of Nunavut by Ethnicity and Origin
The population of Nunavut is quite diverse, which contributes to the territory's vibrant cultural landscape. Nunavut is inclusive and accepts various ethnic groups with open arms. Furthermore, the territory appreciates the unique contributions that each ethnicity brings.
The top 5 ethnicities and origins in Nunavut are Inuit, which accounts for 83.88% of the total population, followed by Scottish (5.72%), Irish (4.32%), English (3.84%), and Canadian (2.80%).
Other ethnicities and origins in Nunavut include French, German, Caucasian (White), European, and Filipino.
| Ethnicity and Origin | Male | Female | Percentage in Population |
|---|---|---|---|
| Inuit | 83.07% | 84.71% | 83.88% |
| Scottish | 5.76% | 5.72% | 5.72% |
| Irish | 4.49% | 4.16% | 4.32% |
| English | 4.06% | 3.61% | 3.84% |
| Canadian | 2.88% | 2.72% | 2.80% |
| French | 2.50% | 2.30% | 2.40% |
| German | 1.70% | 1.66% | 1.67% |
| Caucasian (White) | 1.64% | 1.64% | 1.65% |
| European | 1.10% | 1.08% | 1.09% |
| Filipino | 0.67% | 1.03% | 0.83% |
Indigenous Identity in Nunavut
About 85.77% of Nunavut's population (31,390 people) identify with an Indigenous identity, compared to 14.23% who report a non-Indigenous identity.
Of the Indigenous population, 120 people (0.30% of the total population) hold Registered or Treaty Indian status.
Immigration Profile
Immigration patterns vary a great deal from one area to another, which makes this data one of the more distinctive parts of Nunavut's population profile.
About 3.2% of Nunavut's population are immigrants (1,165 people).
The top countries of origin for Nunavut's immigrant population are Philippines (255), United States of America (65), Nigeria (65), India (65), United Kingdom (55).
| Country of Birth | Population |
|---|---|
| Philippines | 255 |
| United States of America | 65 |
| Nigeria | 65 |
| India | 65 |
| United Kingdom | 55 |
98.9% of Nunavut's residents (36,180 people) are Canadian citizens, and 1.2% are not.
By generation status, 3.5% of residents are first generation (born outside Canada), 2.9% are second generation, and 93.6% are third generation or more.
Household and Dwelling Characteristics
About 4,275 of Nunavut's population live in a single-detached house. In addition, most of them are living in 5 or more persons household.
Household Size
About 16.35% of the population lives in 5 or more persons households. 1 person households ranked second, accounting for 9.85% of the population. 2 persons, 3 persons, and 4 persons households account for 9.65%, 7.15%, and 7.05%, respectively.
| Number of Person(s) in Household | Total | Percentage |
|---|---|---|
| 5 or more persons | 3,245 | 16.35% |
| 1 person | 1,955 | 9.85% |
| 2 persons | 1,915 | 9.65% |
| 3 persons | 1,415 | 7.15% |
| 4 persons | 1,400 | 7.05% |
Dwelling & Housing Detail
Of the 9,925 occupied private dwellings in Nunavut, 19.2% are owner-occupied (1,905) and 80.8% are rented (8,020). The median value of owned dwellings is $400,000 (average $410,800).
Period of Construction
2.4% of Nunavut's occupied private dwellings were built in 1960 or before, while 8.3% were built between 2016 and 2021.
Family and Household Structure in Nunavut
Of census families in Nunavut, 66.8% are couple families and 33.2% are one-parent families. The average census family has 3.6 people.
19.7% of households in Nunavut are one-person households, 41.5% are couple-family households, 14.4% are one-parent-family households, and 13.5% are multigenerational households.
| Household Type | Households | Percentage |
|---|---|---|
| One-person households | 1,955 | 19.7% |
| Couple-family households | 4,115 | 41.5% |
| One-parent-family households | 1,430 | 14.4% |
| Multigenerational households | 1,340 | 13.5% |
Income in Nunavut
Analyzing income distribution in Nunavut can help us better understand its socioeconomic dynamics.
Per Capita Income
According to 2020 data, the median personal income within Nunavut is $37,600.
A region's per capita data sheds light on the average income earned per person living in it. Since per capita income is calculated by dividing the region's total income by its population, it quantifies the population's economic situation on an individual basis.
Such data offers insights into the territory's economic performance, spread of income across individuals, quality of life, as well as disparities within its borders.
Most of Nunavut population or around 3,835 people falls in the Under $10,000 group. The next largest groups are the $100,000 to $149,999, and $10,000 to $29,999 with around 3,700 and 3,235 people, respectively.
Household Income
The Nunavut's median household income is $118,000, according to 2020 data.
Above national average Nunavut's median household income is 34,000 dollars above the Canadian national median of $84,000 (2020 data, 2021 Census).
The data provides important insights into the territory's economic landscape as well as the living standards of its population.
Analyzing such data enables researchers, policymakers, and businesses to gain a more comprehensive understanding of the territory's income distribution, disparities, and trends.
Education Levels in Nunavut
This data sheds light on the distribution of Nunavut residents across educational milestones.
Such information is crucial in shaping the province’s policies on education, workforce development strategies, and initiatives that aim to improve access to quality education and promote lifelong learning opportunities.
45.10% or most of the Nunavut population has a No certificate, diploma or degree. 37.70% of the population has a Postsecondary certificate, diploma or degree, and 17.10% has a High (secondary) school diploma or equivalency certificate. (Individual figures may not sum to exactly 100% due to Statistics Canada's random rounding of small-area 25% sample data.)
| Degree | Men | Women | Total | Percentage |
|---|---|---|---|---|
| No certificate, diploma or degree | 4,025 | 3,675 | 7,700 | 45.10% |
| Postsecondary certificate, diploma or degree | 3,090 | 3,350 | 6,435 | 37.70% |
| High (secondary) school diploma or equivalency certificate | 1,475 | 1,450 | 2,920 | 17.10% |
Below national average 14.1% of Nunavut's population has a bachelor's degree or higher, compared to the national average of 32.9% (Canada, 2021 Census).
Employment in Nunavut
This dataset provides a snapshot of employment trends in Nunavut. It encompasses a wide range of sectors, industries, as well as job categories.
The data shows that the unemployment rate in Nunavut is at 16.93% which is very high.
| Status | Percentage |
|---|---|
| Employment rate | 48.69% |
| Unemployment rate | 16.93% |
Work Activity During the Reference Year
Of the population aged 15 and over in Nunavut, 34.4% worked full year full time in the reference year, 21.5% worked part year and/or part time, and 44.1% did not work.
| Work Activity | Population | Percentage |
|---|---|---|
| Worked full year full time | 8,445 | 34.4% |
| Worked part year and/or part time | 5,275 | 21.5% |
| Did not work | 10,815 | 44.1% |
Working as an Employee
The table shows the data on the total number of individuals in the territory who work as an employee. The majority of Nunavut's population (around 63.30%) are working permanent position as an employee.
Self-employed
In the territory, there are 295 men and 165 women working as self-employed individuals, bringing the total number to 455.
| Status | Men | Women | Total |
|---|---|---|---|
| Self-employed | 295 | 165 | 455 |
Employment Industry Sectors
The Nunavut industry employment sector census data offers insights into the region's economic landscape. The distribution of employment in Nunavut is categorized and quantified, which reveals the region's economic composition.
Nunavut has a wide range of industries. Most of its population (29%) works in the public administration sector. The Retail trade sector comes second at 11%, followed by Educational services at 11%.
| Industry | Men | Women | Percentage |
|---|---|---|---|
| Public administration | 2,075 | 2,145 | 29% |
| Retail trade | 765 | 845 | 11% |
| Educational services | 420 | 1,110 | 11% |
| Health care and social assistance | 290 | 1,015 | 9% |
| Construction | 530 | 90 | 4% |
| Transportation and warehousing | 460 | 130 | 4% |
| Real estate and rental and leasing | 300 | 115 | 3% |
| Mining, quarrying, and oil and gas extraction | 295 | 100 | 3% |
| Administrative and support, waste management and remediation services | 260 | 125 | 3% |
| Accommodation and food services | 130 | 225 | 3% |
| Utilities | 290 | 45 | 2% |
| Professional, scientific and technical services | 160 | 165 | 2% |
| Other services (except public administration) | 165 | 150 | 2% |
| Arts, entertainment and recreation | 150 | 100 | 2% |
| Agriculture, forestry, fishing and hunting | 130 | 20 | 1% |
| Information and cultural industries | 70 | 75 | 1% |
| Finance and insurance | 35 | 70 | 1% |
| Wholesale trade | 65 | 35 | 1% |
| Manufacturing | 55 | 25 | 1% |
| Management of companies and enterprises | 10 | 10 | 0% |
Labour Market Snapshot
A quick snapshot of where Nunavut residents work — the leading industry sectors employing them, and the broad occupation categories they work in.
Top employer sectors in Nunavut: Public administration (29%), Retail trade (11%), Educational services (11%)
Top occupation categories in Nunavut: Sales and service occupations (22%), Occupations in education, law and social, community and government services (21%), Trades, transport and equipment operators and related occupations (18%)
Places of Work
The data offers insights into the commuting patterns as well as workplace distribution in the territory. It provides a snapshot of workplaces, showing their geographic distribution and the flow of workers across different areas.
| Work Location | Men | Women | Total | Percentage |
|---|---|---|---|---|
| Usual place of work | 4,610 | 5,255 | 9,870 | 82.60% |
| No fixed workplace address | 875 | 330 | 1,205 | 10.10% |
| Worked at home | 425 | 450 | 870 | 7.30% |
| Worked outside Canada | 0 | 0 | 10 | 0.10% |
Commuting
The data sheds light on how Nunavut residents travel to school or work. It highlights the frequency of different modes of transportation like walking, cycling, carpooling, and public transit.
The data is pivotal in the making of transportation policies as well as the development of transit systems. Ultimately commuting data contributes to improving the quality of life of Nunavut residents and sustainable urban planning.
Commuting Duration
This data reveals the average time that the residents of Nunavut spend traveling to their workplaces. It also sheds light on the efficiency of the territory's public transit systems, and road networks, as well as the accessibility of the territory.
| Duration | Percentage |
|---|---|
| Less than 15 minutes | 87.30% |
| 15 to 29 minutes | 9.90% |
| 30 to 44 minutes | 1.20% |
| 60 minutes and over | 1.20% |
| 45 to 59 minutes | 0.40% |
Marital Status
The statistics on marital status in Nunavut shed light on its societal dynamics. It captures the diverse types of marital statuses of the population.
Long-term commitments, such as common-law partnerships, civil unions, and marriages, reflect the territory's social fabric. We can gain insights into Nunavut's changing preferences and norms by examining the trends in marital status.
Language Spoken
The data below highlights territory's linguistic diversity, showing elegances of solo language as well as bilingual harmonies. Other than language, it also shows the cultural landscape in Canada.
English is the most spoken official language in Nunavut. About 33,955 people living in the territory speak English, 2,025 people speak Neither English nor French, 575 people speak French language, and 95 people speak English and French language.
| Language | Population |
|---|---|
| English | 33,955 |
| Neither English nor French | 2,025 |
| French | 575 |
| English and French | 95 |
Knowledge of Official Languages
About 3.8% of Nunavut's population is bilingual, knowing both English and French. 90.3% know English only, 0.2% know French only, and 5.7% know neither official language.
| Knowledge of Official Languages | Population | Percentage |
|---|---|---|
| English only | 33,105 | 90.3% |
| French only | 65 | 0.2% |
| English and French | 1,390 | 3.8% |
| Neither English nor French | 2,085 | 5.7% |
Mother Tongue & Home Language
Useful for newcomers researching an area: this shows the language residents first learned at home in childhood (mother tongue) and the language they speak most often at home now, which can differ as families settle in.
| Language | Mother Tongue | Spoken Most Often at Home |
|---|---|---|
| Non-official languages | 54.9% | 42.2% |
| English | 33.0% | 46.6% |
| French | 1.4% | 0.9% |
Religion
Nunavut is predominantly Christian. About 26,915 of its population is Christian (13,510 males and 13,410 females).
The second largest religion in the territory is Muslim with 0.4% of the population adhering to the religion. There are also Hindu and Jewish, both represent 0.2% and 0.1% of the population, while Buddhist represent 0.0% of the population.
| Religion | Population |
|---|---|
| Christian | 73.5% |
| Islam | 0.4% |
| Hindu | 0.2% |
| Jewish | 0.1% |
| Buddhist | 0.0% |
| Sikh | 0.0% |
Cities in Nunavut
Methodology
- Data vintage: Reference date was Census Day, May 11, 2021. Statistics Canada released this profile in stages starting February 9, 2022, with later characteristics added through the remainder of 2022.
- Rounding & suppression: To protect respondent confidentiality, Statistics Canada randomly rounds every count shown here, and withholds some characteristics entirely for areas with very small populations. This is why a small number of figures on this page may show as unavailable for smaller places — it reflects a StatCan privacy rule, not missing data on our end.
- Next update: These are the most recent figures available. Canada's next census is scheduled for May 2026, with results expected to begin release in 2027.
Frequently Asked Questions about Nunavut
What is the population of Nunavut?
According to the 2021 Statistics Canada Census, Nunavut has a population of 36,858 people, making it the 13th territory in Canada. The population increased moderately from 35,944 in 2016, an increase of 914 people or 2.54%. The territory has a population density of 0.0 people per km² across a land area of 1,836,993.78 km². The 2026 Census results are expected from Statistics Canada beginning February 2027.
Is the population of Nunavut growing?
Nunavut's population grew by 2.54% between the 2016 and 2021 censuses — from 35,944 to 36,858 people, a gain of 914 residents. This modest growth reflects patterns seen in many other Canadian territories during this period. The median age of 25.60 years suggests a comparatively young population. Official 2026 Census data, which will confirm whether this trend continued, is expected from Statistics Canada in February 2027.
What is the population density of Nunavut?
Nunavut has a population density of approximately 0.00 people per square kilometre.
How large is Nunavut?
Nunavut covers a land area of approximately 1,836,993.78 km².
What is the median age in Nunavut?
The median age of the population in Nunavut is 25.60 years.
What is the largest ethnic group in Nunavut?
The largest ethnic or cultural origin group in Nunavut is Inuit.
What is the median household income in Nunavut?
The median household income in Nunavut is $118,000, based on 2020 data.
What is the most spoken language in Nunavut?
English is the most common first official language spoken in Nunavut.
What is the main religion in Nunavut?
Christian is the predominant religion in Nunavut.
What percentage of Nunavut's population is Indigenous?
According to the 2021 Census, 85.8% of Nunavut's population identifies with an Indigenous identity.
What percentage of Nunavut residents are Canadian citizens?
98.9% of Nunavut's residents are Canadian citizens, based on 2021 Census data.
What percentage of families in Nunavut are one-parent families?
One-parent families make up 33.2% of census families in Nunavut, according to the 2021 Census.
Are there many multigenerational households in Nunavut?
Multigenerational households make up 13.5% of all households in Nunavut, per the 2021 Census.
What percentage of Nunavut's population is bilingual in English and French?
3.8% of Nunavut's population knows both English and French, based on 2021 Census data on knowledge of official languages.
What percentage of Nunavut's workforce works full-time year-round?
Of the population aged 15 and over in Nunavut, 34.4% worked full year full time in the 2021 Census reference year.
Why isn't 2026 census data for Nunavut available yet?
Statistics Canada (statcan.gc.ca) conducted the 2026 Census of Population in May 2026. However, census data goes through an extensive processing, validation, and quality-assurance period before public release. Based on the release plan, the 2026 Census results begin rolling out on February 10, 2027, with complete community-level profiles available by December 1, 2027. Until then, this page uses 2021 Census data as its primary source, supplemented by a population projection estimate for 2026 calculated using the compound annual growth rate (CAGR) from the 2016–2021 Census period.