Population Characteristics
According to the latest census, Ottawa has a population of around 1,017,449 people. The city's population is in increased . Between 2016 and 2021, the population of Ottawa has increased by 8.91%.
| Population in 2016 | Population in 2021 | Difference |
|---|---|---|
| 934,243 | 1,017,449 | +8.91% |
2026 Population Projection
Based on the compound annual growth rate (CAGR) of 1.72% observed between the 2016 and 2021 censuses, Ottawa's population is projected to reach approximately 1,108,066 people by 2026, with a projected population density of around 397.41 people per km².
| Population in 2021 | Projected Population in 2026 | Projected Density in 2026 (per km²) |
|---|---|---|
| 1,017,449 | 1,108,066 | 397.41 |
This projection is an estimate calculated by CAPopulation from the compound annual growth rate between the 2016 and 2021 censuses. Official 2026 complete census data expected to be released in late 2027.
Population By Genders
The male population of Ottawa is around 496,045 while the female population is around 521,405.
Of the 1,017,449 total population in Ottawa, the largest gender is female with around 521,405 women within the population.
| Male | Female | Difference |
|---|---|---|
| 496,045 | 521,405 | +4.86% |
Is Ottawa a Good Place to Live?
Based on 2021 Statistics Canada Census data, here's how Ottawa compares across key quality-of-life indicators — measured against Ontario, its own province. Draw your own conclusions from the actual numbers.
Employment & Economy
Income & Affordability
Commute
Housing Character
Household Composition
Source: Statistics Canada, 2021 Census of Population.
Other Cities Near Ottawa
- Clarence-Rockland (35.4 km)
- Cornwall (85.7 km)
- Brockville (90.8 km)
Population by Age Characteristics
Ottawa has a young population. The majority of the population is people aged 25 to 29 years old, accounting for 7.20% of the total population. The city median age is 40.00.
| Data | Male | Female | Difference | Total |
|---|---|---|---|---|
| 25 to 29 years | 36,540 7.40% | 36,295 7.00% | 0.67% | 72,830 7.20% |
| 55 to 59 years | 35,225 7.10% | 36,235 6.90% | 2.79% | 71,465 7.00% |
| 20 to 24 years | 35,910 7.20% | 34,875 6.70% | 2.88% | 70,785 7.00% |
| 30 to 34 years | 34,670 7.00% | 35,520 6.80% | 2.39% | 70,190 6.90% |
| 35 to 39 years | 33,780 6.80% | 35,735 6.90% | 5.47% | 69,520 6.80% |
| 50 to 54 years | 32,775 6.60% | 34,490 6.60% | 4.97% | 67,265 6.60% |
| 45 to 49 years | 31,705 6.40% | 34,540 6.60% | 8.21% | 66,240 6.50% |
| 40 to 44 years | 31,520 6.40% | 34,370 6.60% | 8.29% | 65,890 6.50% |
| 60 to 64 years | 30,710 6.20% | 33,090 6.30% | 7.19% | 63,795 6.30% |
| 10 to 14 years | 30,930 6.20% | 29,790 5.70% | 3.69% | 60,720 6.00% |
| 15 to 19 years | 30,685 6.20% | 29,705 5.70% | 3.19% | 60,385 5.90% |
| 5 to 9 years | 29,290 5.90% | 28,125 5.40% | 3.98% | 57,410 5.60% |
| 65 to 69 years | 24,910 5.00% | 27,445 5.30% | 9.24% | 52,355 5.10% |
| 0 to 4 years | 24,600 5.00% | 24,195 4.60% | 1.65% | 48,790 4.80% |
| 70 to 74 years | 21,150 4.30% | 24,230 4.60% | 12.71% | 45,375 4.50% |
| 75 to 79 years | 14,100 2.80% | 16,840 3.20% | 16.27% | 30,940 3.00% |
| 85 years and over | 8,350 1.70% | 14,050 2.70% | 40.57% | 22,395 2.20% |
| 80 to 84 years | 9,190 1.90% | 11,890 2.30% | 22.71% | 21,080 2.10% |
| 85 to 89 years | 5,445 1.10% | 7,940 1.50% | 31.42% | 13,385 1.30% |
| 90 to 94 years | 2,305 0.50% | 4,470 0.90% | 48.43% | 6,775 0.70% |
| 95 to 99 years | 540 0.10% | 1,415 0.30% | 61.84% | 1,960 0.20% |
| 100 years and over | 55 0.00% | 220 0.00% | 75.00% | 275 0.00% |
Broader Age Groups
If the city's population is divided into broader age groups, most of the population falls into the 15 to 64 years age group. The group accounts for 66.70% of the population. The other age groups, 65 years and over and 0 to 14 years, account for 16.90% and 16.40%, respectively.
If we look at the population data from the broader age groups, we can see that most people in Ottawa are within the 15 to 64 years age group.
| Data | Male | Female | Total |
|---|---|---|---|
| 15 to 64 years | 67.20% | 66.10% | 66.70% |
| Average age of the population | 39.80% | 41.50% | 40.70% |
| Median age of the population | 38.80% | 40.80% | 40.00% |
| 65 years and over | 15.70% | 18.10% | 16.90% |
| 0 to 14 years | 17.10% | 15.70% | 16.40% |
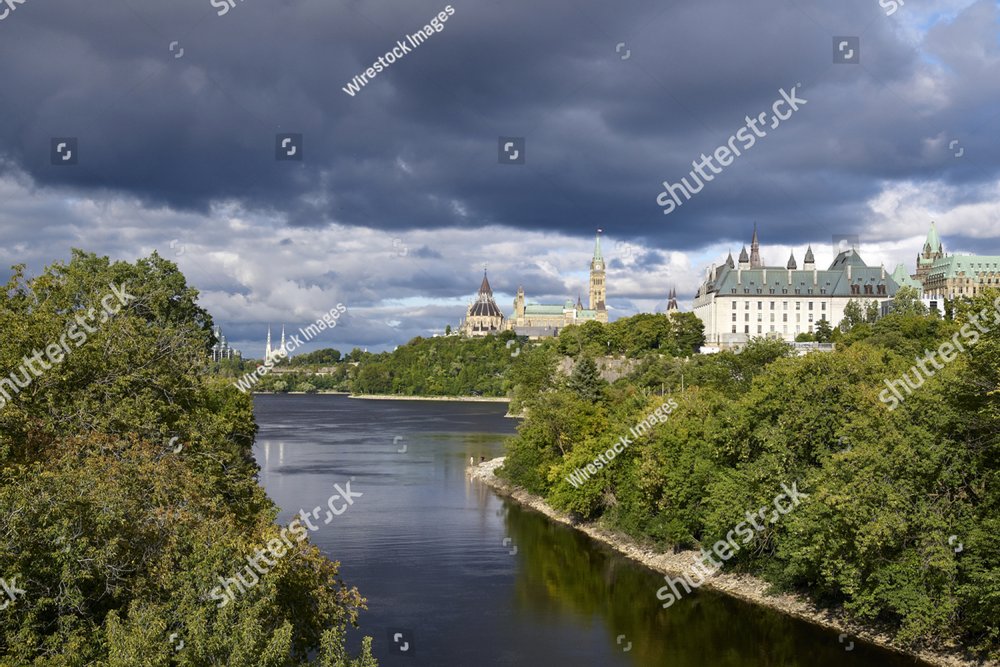
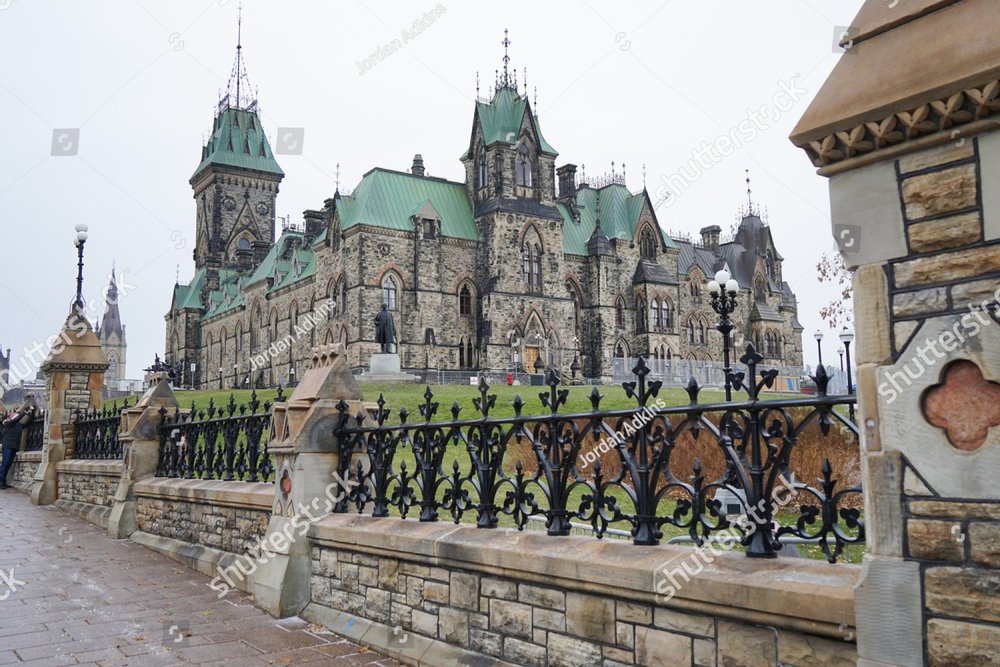
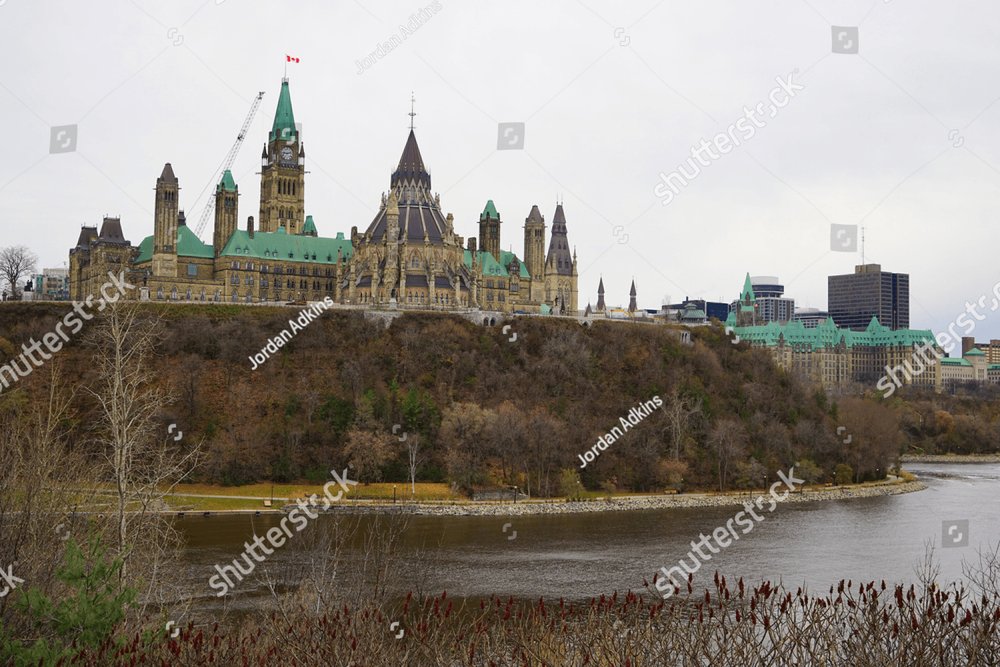
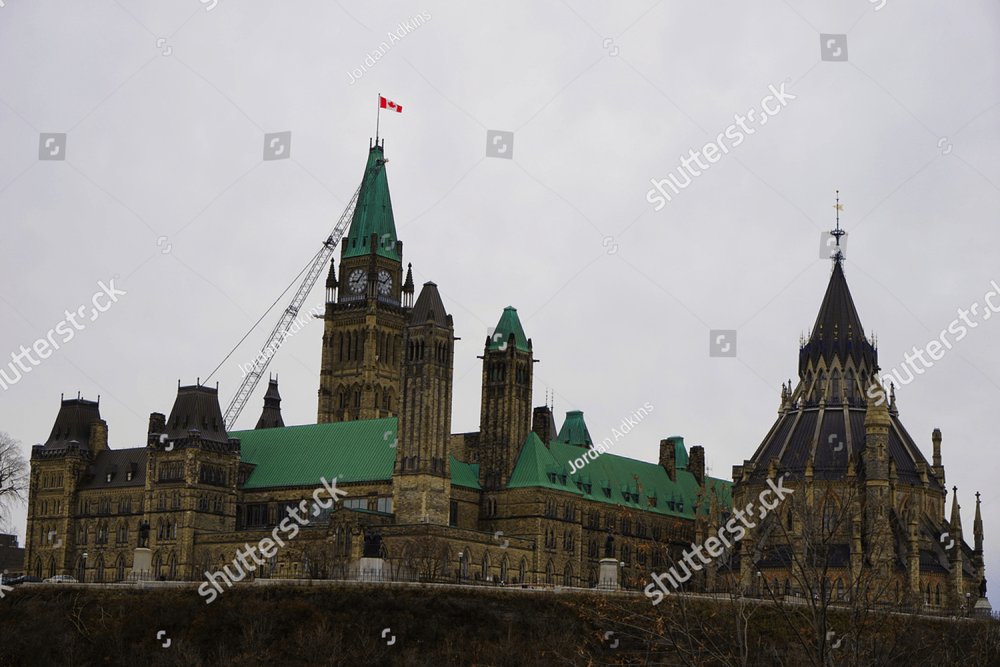
Photos of Places & Sceneries in Ottawa

Explore Ottawa Through Videos
Population of Ottawa by Ethnicity and Origin
The population of Ottawa is quite diverse, which contributes to the city's vibrant cultural landscape. Ottawa is inclusive and accepts various ethnic groups with open arms. Furthermore, the province appreciates the unique contributions that each ethnicity brings.
The top 5 ethnicities and origins in the province are Irish, which accounts for 19.21% of the total population, followed by Scottish (16.01%), English (15.63%), French (14.06%), and Canadian (11.41%).
Other ethnicities and origins in Newfoundland and Labrador include German, Chinese, Italian, British Isles, and French Canadian.
| Ethnicity and Origin | Male | Female | Percentage in Population |
|---|---|---|---|
| Irish | 18.78% | 19.62% | 19.21% |
| Scottish | 16.11% | 15.91% | 16.01% |
| English | 15.78% | 15.49% | 15.63% |
| French | 13.89% | 14.22% | 14.06% |
| Canadian | 11.73% | 11.10% | 11.41% |
| German | 7.40% | 7.32% | 7.36% |
| Chinese | 4.57% | 5.00% | 4.79% |
| Italian | 4.64% | 4.49% | 4.56% |
| British Isles | 3.85% | 3.89% | 3.87% |
| French Canadian | 3.14% | 3.42% | 3.28% |
Immigration Profile
Immigration patterns vary a great deal from one area to another, which makes this data one of the more distinctive parts of Ottawa's population profile.
About 25.9% of Ottawa's population are immigrants (259,215 people).
The top countries of origin for Ottawa's immigrant population are China (20,320), India (16,195), United Kingdom (14,765), Lebanon (11,905), Philippines (10,505).
| Country of Birth | Population |
|---|---|
| China | 20,320 |
| India | 16,195 |
| United Kingdom | 14,765 |
| Lebanon | 11,905 |
| Philippines | 10,505 |
Household and Dwelling Characteristics
About 169,760 of Ottawa's population live in a single-detached house. In addition, most of them are living in 2 persons household.
Household Size
About 16.60% of the population lives in 2 persons households. 1 person households ranked second, accounting for 14.30% of the population. 3 persons, 4 persons, and 5 or more persons households account for 7.60%, 7.25%, and 4.25%, respectively.
| Number of Person(s) in Household | Total | Percentage |
|---|---|---|
| 2 persons | 135,365 | 16.60% |
| 1 person | 116,370 | 14.30% |
| 3 persons | 61,740 | 7.60% |
| 4 persons | 59,175 | 7.25% |
| 5 or more persons | 34,605 | 4.25% |
Income in Ottawa
Analyzing income distribution in Ottawa can help us better understand its socioeconomic dynamics.
Per Capita Income
According to 2020 data, the median personal income within Ottawa is $50,000.
A region's per capita data sheds light on the average income earned per person living in it. Since per capita income is calculated by dividing the region's total income by its population, it quantifies the population's economic situation on an individual basis.
Such data offers insights into the city's economic performance, spread of income across individuals, quality of life, as well as disparities within its borders.
Most of Ottawa population or around 117,420 people falls in the $50,000 to $79,999 group. The next largest groups are the $10,000 to $29,999, and $100,000 to $149,999 with around 104,460 and 96,335 people, respectively.
Household Income
The Ottawa's median household income is $102,000, according to 2020 data.
Above national average Ottawa's median household income is 18,000 dollars above the Canadian national median of $84,000 (2020 data, 2021 Census).
The data provides important insights into the city's economic landscape as well as the living standards of its population.
Analyzing such data enables researchers, policymakers, and businesses to gain a more comprehensive understanding of the city's income distribution, disparities, and trends.
Education Levels in Ottawa
This data sheds light on the distribution of Ottawa residents across educational milestones.
Such information is crucial in shaping the province’s policies on education, workforce development strategies, and initiatives that aim to improve access to quality education and promote lifelong learning opportunities.
71.35% or most of the Ottawa population has a Postsecondary certificate, diploma or degree. 45.45% of the population has a Bachelor's degree or higher, 20.30% has a High (secondary) school diploma or equivalency certificate, and 8.30% has No certificate, diploma or degree.
| Degree | Men | Women | Total | Percentage |
|---|---|---|---|---|
| Postsecondary certificate, diploma or degree | 458,280 | 509,130 | 967,415 | 71.35% |
| Bachelor's degree or higher | 287,485 | 326,925 | 614,400 | 45.45% |
| High (secondary) school diploma or equivalency certificate | 148,515 | 139,295 | 287,810 | 20.30% |
| No certificate, diploma or degree | 61,570 | 60,645 | 122,215 | 8.30% |
Above national average 45.5% of Ottawa's population has a bachelor's degree or higher, compared to the national average of 32.9% (Canada, 2021 Census).
Employment in Ottawa
This dataset provides a snapshot of employment trends in Ottawa. It encompasses a wide range of sectors, industries, as well as job categories.
The data shows that the unemployment rate in Newfoundland and Labrador is at 6.81% which is quite high.
| Status | Percentage |
|---|---|
| Employment rate | 59.12% |
| Unemployment rate | 6.81% |
Working as an Employee
The table shows the data on the total number of individuals in the city who work as an employee. The majority of Ottawa's population (around 70.40%) are working permanent position as an employee.
Self-employed
In the city, there are 39,420 men and 26,110 women working as self-employed individuals, bringing the total number to 65,530.
| Status | Men | Women | Total |
|---|---|---|---|
| Self-employed | 39,420 | 26,110 | 65,530 |
Employment Industry Sectors
The Ottawa industry employment sector census data offers insights into the region's economic landscape. The distribution of employment in Ottawa is categorized and quantified, which reveals the region's economic composition.
Ottawa has a wide range of industries. Most of its population (21%) works in the public administration sector. The Health care and social assistance sector comes second at 11%, followed by Professional, scientific and technical services at 11%.
| Industry | Men | Women | Percentage |
|---|---|---|---|
| Public administration | 56,630 | 59,600 | 21% |
| Health care and social assistance | 14,360 | 48,500 | 11% |
| Professional, scientific and technical services | 38,045 | 23,790 | 11% |
| Retail trade | 27,595 | 25,760 | 10% |
| Educational services | 13,800 | 28,210 | 8% |
| Construction | 23,870 | 4,210 | 5% |
| Accommodation and food services | 13,895 | 14,075 | 5% |
| Administrative and support, waste management and remediation services | 13,835 | 8,465 | 4% |
| Other services (except public administration) | 8,790 | 11,725 | 4% |
| Transportation and warehousing | 14,500 | 4,085 | 3% |
| Finance and insurance | 9,085 | 9,325 | 3% |
| Manufacturing | 11,435 | 4,795 | 3% |
| Information and cultural industries | 7,900 | 4,885 | 2% |
| Wholesale trade | 7,960 | 2,965 | 2% |
| Arts, entertainment and recreation | 4,875 | 4,800 | 2% |
| Real estate and rental and leasing | 4,780 | 3,980 | 2% |
| Agriculture, forestry, fishing and hunting | 1,500 | 955 | 0% |
| Utilities | 1,110 | 495 | 0% |
| Management of companies and enterprises | 430 | 405 | 0% |
| Mining, quarrying, and oil and gas extraction | 450 | 100 | 0% |
Labour Market Snapshot
A quick snapshot of where Ottawa residents work — the leading industry sectors employing them, and the broad occupation categories they work in.
Top employer sectors in Ottawa: Public administration (21%), Health care and social assistance (11%), Professional, scientific and technical services (11%)
Top occupation categories in Ottawa: Sales and service occupations (21%), Business, finance and administration occupations (20%), Occupations in education, law and social, community and government services (17%)
Places of Work
The data offers insights into the commuting patterns as well as workplace distribution in the city. It provides a snapshot of workplaces, showing their geographic distribution and the flow of workers across different areas.
| Work Location | Men | Women | Total | Percentage |
|---|---|---|---|---|
| Usual place of work | 116,485 | 116,145 | 232,625 | 47.20% |
| Worked at home | 104,575 | 111,125 | 215,705 | 43.70% |
| No fixed workplace address | 32,430 | 10,645 | 43,070 | 8.70% |
| Worked outside Canada | 1,125 | 620 | 1,745 | 0.40% |
Commuting
The data sheds light on how Ottawa residents travel to school or work. It highlights the frequency of different modes of transportation like walking, cycling, carpooling, and public transit.
The data is pivotal in the making of transportation policies as well as the development of transit systems. Ultimately commuting data contributes to improving the quality of life of Ottawa residents and sustainable urban planning.
Commuting Duration
This data reveals the average time that the residents of Ottawa spend traveling to their workplaces. It also sheds light on the efficiency of the city's public transit systems, and road networks, as well as the accessibility of the city.
| Duration | Percentage |
|---|---|
| 15 to 29 minutes | 42.20% |
| Less than 15 minutes | 26.90% |
| 30 to 44 minutes | 20.10% |
| 45 to 59 minutes | 5.80% |
| 60 minutes and over | 5.10% |
Marital Status
The statistics on marital status in Ottawashed light on its societal dynamics. It captures the diverse types of marital statuses of the population.
Long-term commitments, such as common-law partnerships, civil unions, and marriages, reflect the city's social fabric. We can gain insights into Ottawa's changing preferences and norms by examining the trends in marital status.
Language Spoken
The data below highlights city's linguistic diversity, showing elegances of solo language as well as bilingual harmonies. Other than language, it also shows the cultural landscape in Canada.
English is the most spoken official language in Ottawa. About 824,560 people living in the province speak English, 141,555 people speak French, 25,845 people speak English and French language, and 15,000 people speak Neither English nor French language.
| Language | Population |
|---|---|
| English | 824,560 |
| French | 141,555 |
| English and French | 25,845 |
| Neither English nor French | 15,000 |
Mother Tongue & Home Language
Useful for newcomers researching an area: this shows the language residents first learned at home in childhood (mother tongue) and the language they speak most often at home now, which can differ as families settle in.
| Language | Mother Tongue | Spoken Most Often at Home |
|---|---|---|
| English | 58.2% | 73.0% |
| Non-official languages | 23.1% | 12.4% |
| French | 12.5% | 8.2% |
Religion
Ottawa is predominantly Christian. About 528,700 of its population is Christian (244,560 males and 244,560 females).
The second largest religion in the province is Muslim with 9.9% of the population adhering to the religion. There are also Hindu and Buddhist, both represent 2.0% and 1.1% of the population, while Jewish represent 1.1% of the population.
| Religion | Population |
|---|---|
| Christian | 52.8% |
| Islam | 9.9% |
| Hindu | 2.0% |
| Buddhist | 1.1% |
| Jewish | 1.1% |
| Sikh | 0.6% |
Points of Interest in Ottawa
Schools
- Ottawa Adventist School
- MindWare Academy
- Programme de langue internationale à l'élémentaire
- Éducation permanente
- Éducation sans frontiers - éte
- MacSkimming Outdoor Education Centre
- Reality Check
- First Place Alternate Program
- Family Reception Centre
- Storefront School
- Kanata Montessori School
- Blyth Academy The Glebe
- The Element
- Revel Academy
- TR Leger School - Kemptville
- Beaverbrook Math Academy
- March Academy
- Ottawa Torah Institute
- Glebe Montessori School
- Richard Pfaff Secondary Alternate Program
- M.F. McHugh Education Centre
- Continuing Education
- Le Carrefour Adult School
- L'Alternative Public High School
- Chesterton Academy
- Providence Academy Antonine Sisters
- Cedar Ridge High School
- Blue Sky School
- Adult High School Preschool Program
- TR Leger School - Carleton Place
- Torah High Ottawa
- St. Timothy's Classical Academy
- Manor Park Child Care Centre
- Le Cercle des savoirs
Libraries
- Ottawa Public Library - Nepean Centrepointe Branch
- Ottawa Public Library - Main Branch
- Ottawa Public Library - North Gower Branch
- Ottawa Public Library - Ruth E. Dickinson Branch
- Ottawa Public Library - St-Laurent Branch
- Arnprior Public Library
- Bibliothèque Aurélien-Doucet
- Greenberg Families Library
- SDG Library - Winchester Branch
- Chelsea Public Library
- Morisset Library
- Brian Dickson Law Library
- The Nation Public Library - Limoges Branch
- Ottawa Trans Library
- Bibliothèque Maison du Citoyen
- Ottawa Public Library - Constance Bay Branch
- Russell Public Library - Embrun Branch
- SDG Library - Williamsburg Branch
Community Centres
- South Fallingbrook Community Centre
- Fisher Park Community Center
- New Edinburgh Community and Arts Centre
- Institut Canadien Français d'Ottawa
- Beaverbrook Community Centre
- Carson Community House
- Winthrop Court Community House
Places to Visit in Ottawa
Museums
- Diefenbunker
- Mackenzie-King Estate
- Pinhey's Point
- Cumberland Heritage Village Museum
- Bank of Canada Museum
- Canada Agriculture and Food Museum
- Arnprior & District Museum
- Billings Estate Museum
- Rideau Museum & Archives
Attractions
- Twin Towns Statue
- Parliament Hill
- Carleton Place Hockey Arena
- Domaine Mackenzie-King
- Penny's Fudge Factory
- The Haunted Walk of Ottawa
- Byward Market
- Geodetic Survey Monument
- Zip lines and aerial parks
Historic Sites
- Statue de Maurice Richard
- Saint Jean de Brebeuf
- Cape North Lighthouse
- Long Island Locks
- Homage à la communauté portugaise
- Cenotaph
- National Aboriginal Veterans Monument
- Stittsville Cenotaph
- Westboro cenotaph
- Brigadier Andrew Hamilton Gault
- Tomb of the Unknown Soldier
- Hungarian Monument
- T-33
- Canadian Firefighters Memorial
- Canadian Police Memorial
- Oscar Peterson
- Ottawa Fire Fighters
- The Canadian Role in the Defence of Hong Kong
- National Artillery Memorial
- Richmond Cenotaph
- Louis St. Laurent
- Arthur Doughty
- South African War Memorial
- Kwakiutl Totem
- Polish Home Army - Canadian Airmen Memorial
Theatres
Green Spaces in Ottawa
| Name | Type | Approx. Area |
|---|---|---|
| Theatre du Village | Parks | — |
| Baxter Conservation Area back entrance | Parks | — |
| Checkerspot Park | Parks | — |
| Annie Pootoogook Park | Parks | 1.5 ha |
| Burnett Park | Parks | 4.5 ha |
| Weybridge Park | Parks | 4.2 ha |
| Redpine Park | Parks | 1.3 ha |
| Borden Farm Park | Parks | 1.4 ha |
| Raoul Wallenberg Park | Parks | 3.0 ha |
| Gilbey Park | Parks | 3.3 ha |
| Nepean Creek Park | Parks | 37.7 ha |
| Ben Franklin Park East | Parks | 12.7 ha |
| Ben Franklin Park West | Parks | 8.3 ha |
| Arlington Woods Park | Parks | 6.1 ha |
| Bateman Park | Parks | 0.7 ha |
| Pinecrest Recreation Complex and Park | Parks | 12.5 ha |
| Dominion Arboretum | Parks | 33.2 ha |
| Mulligan Park | Parks | 2.9 ha |
| Totteridge Park | Parks | 0.9 ha |
| Finchley Park | Parks | 0.4 ha |
| Tierney Park | Parks | 0.9 ha |
| Leslie Park | Parks | 4.3 ha |
| Craig Henry Park | Parks | 10.5 ha |
| Rideau Canal | Nature Reserves | — |
| Innis Point Bird Observatory | Nature Reserves | — |
Areas are approximate, calculated from OpenStreetMap boundary data.
Frequently Asked Questions about Ottawa
According to the 2021 census, Ottawa has a population of approximately 1,017,449 people.
Between 2016 and 2021, the population of Ottawa increased by 8.91%.
Ottawa has a population density of approximately 364.90 people per square kilometre.
Ottawa covers a land area of approximately 2,788.20 km².
The median age of the population in Ottawa is 40.00 years.
The largest ethnic or cultural origin group in Ottawa is Irish.
The median household income in Ottawa is $102,000, based on 2020 data.
English is the most common first official language spoken in Ottawa.
Christian is the predominant religion in Ottawa.
Statistics Canada (statcan.gc.ca) conducted the 2026 Census of Population in May 2026. However, census data goes through an extensive processing, validation, and quality-assurance period before public release. Based on the release plan, the 2026 Census results begin rolling out on February 10, 2027, with complete community-level profiles available by December 1, 2027. Until then, this page uses 2021 Census data as its primary source, supplemented by a population projection estimate for 2026 calculated using the compound annual growth rate (CAGR) from the 2016–2021 Census period.