About Northwest Territories
The Northwest Territories is where adventure gets a capital A. This place isn’t just big-it’s colossal. Covering over 1.3 million square kilometers, it’s like someone decided Canada needed more wilderness and just kept going.
A few years back, I met a guy in Yellowknife who swore you could ice-fish in the morning, watch the aurora borealis at night, and still have time to grab a poutine in between. He wasn’t wrong. Yellowknife, the capital, has a charm all its own. The locals? Tough as nails but quick to flash a smile. Their stories? Even better-one person claimed they once saw a moose wander into a Tim Hortons parking lot. True or not, it sounds about right for here.
Let’s talk about the Great Slave Lake. It’s enormous. Not just a “wow, that’s big” kind of big, but the sort of size that makes you question why we call it a lake and not an inland ocean. People comes from all over the region to fish, paddle, or just to stare at the horizon and wonder what lies beyond.
The auroras here? They don’t just dance-they throw a full-blown rave across the sky. Green, purple, and sometimes red streaks light up the darkness, and honestly, you start wondering if the universe is just showing off at this point.
Then there’s Nahanni National Park Reserve, a waterfalls that make Niagara look like a leaky faucet, dramatic canyons, and hiking trails that’ll leave your legs sore for days. Worth it? Every step.
Living in the Northwest Territories isn’t for the faint-hearted. The winters are brutal, the summers come with mosquitoes the size of small aircraft, and yet people stay. Why? Maybe it’s the call of the wild, or perhaps it’s the way the Northwest Territories makes you feel alive.
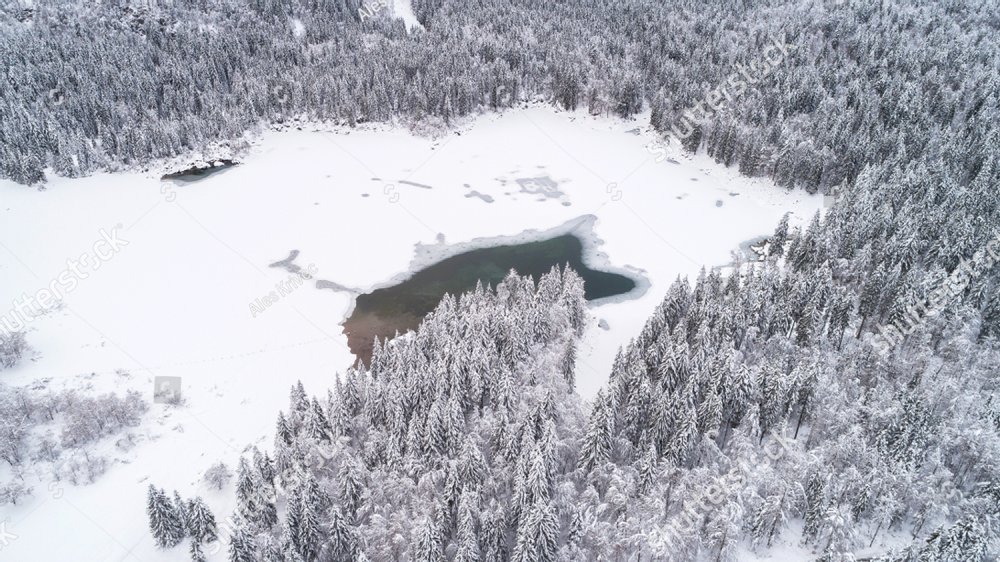
Photos of Places & Sceneries in Northwest Territories


Population Characteristics
According to the latest census, Northwest Territories has a population of around 41,070 people. The territory's population is in decreased . Between 2016 and 2021, the population of Newfoundland and Labrador has decreased by -1.71%.
| Population in 2016 | Population in 2021 | Difference |
|---|---|---|
| 41,786 | 41,070 | --1.71% |
Population By Genders
The male population of Northwest Territories is around 20,840 while the female population is around 20,230.
Of the 41,070 total population in Northwest Territories, the largest gender is male with around 20,840 women within the population.
| Male | Female | Difference |
|---|---|---|
| 20,840 | 20,230 | -2.93% |
Population by Age Characteristics
Northwest Territories has a young population. The majority of the population is people aged 30 to 34 years old, accounting for 8.50% of the total population. The territory median age is 35.60.
| Data | Male | Female | Difference | Total |
|---|---|---|---|---|
| 30 to 34 years | 1,710 8.20% | 1,795 8.90% | 4.74% | 3,510 8.50% |
| 25 to 29 years | 1,610 7.70% | 1,540 7.60% | 4.35% | 3,150 7.70% |
| 35 to 39 years | 1,570 7.50% | 1,565 7.70% | 0.32% | 3,135 7.60% |
| 40 to 44 years | 1,465 7.00% | 1,510 7.50% | 2.98% | 2,980 7.30% |
| 55 to 59 years | 1,515 7.30% | 1,405 6.90% | 7.26% | 2,920 7.10% |
| 10 to 14 years | 1,415 6.80% | 1,410 7.00% | 0.35% | 2,830 6.90% |
| 0 to 4 years | 1,480 7.10% | 1,345 6.60% | 9.12% | 2,825 6.90% |
| 5 to 9 years | 1,420 6.80% | 1,400 6.90% | 1.41% | 2,820 6.90% |
| 50 to 54 years | 1,385 6.60% | 1,345 6.60% | 2.89% | 2,730 6.60% |
| 45 to 49 years | 1,310 6.30% | 1,315 6.50% | 0.38% | 2,620 6.40% |
| 20 to 24 years | 1,340 6.40% | 1,215 6.00% | 9.33% | 2,555 6.20% |
| 15 to 19 years | 1,280 6.10% | 1,250 6.20% | 2.34% | 2,530 6.20% |
| 60 to 64 years | 1,235 5.90% | 1,130 5.60% | 8.50% | 2,365 5.80% |
| 65 to 69 years | 870 4.20% | 785 3.90% | 9.77% | 1,650 4.00% |
| 70 to 74 years | 595 2.90% | 520 2.60% | 12.61% | 1,115 2.70% |
| 75 to 79 years | 350 1.70% | 350 1.70% | 0.00% | 695 1.70% |
| 80 to 84 years | 145 0.70% | 205 1.00% | 29.27% | 350 0.90% |
| 85 years and over | 140 0.70% | 145 0.70% | 3.45% | 290 0.70% |
| 85 to 89 years | 90 0.40% | 65 0.30% | 27.78% | 155 0.40% |
| 90 to 94 years | 45 0.20% | 70 0.30% | 35.71% | 115 0.30% |
| Average age of the population | 36 36.40% | 36 36.30% | 0.00% | 36 36.40% |
Broader Age Groups
If the territory's population is divided into broader age groups, most of the population falls into the 15 to 64 years age group. The group accounts for 69.40% of the population. The other age groups, 0 to 14 years and 65 years and over, account for 20.60% and 10.00%, respectively.
If we look at the population data from the broader age groups, we can see that most people in Northwest Territories are within the 15 to 64 years age group.
| Data | Male | Female | Total |
|---|---|---|---|
| Median age of the population | 35.60% | 35.60% | 35.60% |
| 0 to 14 years | 20.70% | 20.60% | 20.60% |
| 65 years and over | 10.10% | 9.90% | 10.00% |
Explore Northwest Territories Through Videos
Population of Northwest Territories by Ethnicity and Origin
The population of Northwest Territories is quite diverse, which contributes to the territory's vibrant cultural landscape. Northwest Territories is inclusive and accepts various ethnic groups with open arms. Furthermore, the province appreciates the unique contributions that each ethnicity brings.
The top 5 ethnicities and origins in the province are English, which accounts for 13.61% of the total population, followed by Scottish (13.05%), Dene (11.70%), Irish (11.69%), and Canadian (8.37%).
Other ethnicities and origins in Newfoundland and Labrador include French, First Nations (North American Indian), German, Filipino, and Inuit.
| Ethnicity and Origin | Male | Female | Percentage in Population |
|---|---|---|---|
| English | 13.66% | 13.56% | 13.61% |
| Scottish | 12.38% | 13.71% | 13.05% |
| Dene | 11.58% | 11.81% | 11.70% |
| Irish | 11.80% | 11.58% | 11.69% |
| Canadian | 8.52% | 8.22% | 8.37% |
| French | 8.54% | 7.87% | 8.22% |
| First Nations (North American Indian) | 7.05% | 7.45% | 7.23% |
| German | 7.15% | 6.77% | 6.97% |
| Filipino | 3.38% | 4.31% | 3.84% |
| Inuit | 3.23% | 3.58% | 3.41% |
Household and Dwelling Characteristics
About 8,600 of Northwest Territories's population live in a single-detached house. In addition, most of them are living in 2 persons household.
Household Size
About 14.75% of the population lives in 2 persons households. 1 person households ranked second, accounting for 13.10% of the population. 3 persons, 4 persons, and 5 or more persons households account for 8.40%, 7.90%, and 5.85%, respectively.
| Number of Person(s) in Household | Total | Percentage |
|---|---|---|
| 2 persons | 4,490 | 14.75% |
| 1 person | 3,985 | 13.10% |
| 3 persons | 2,560 | 8.40% |
| 4 persons | 2,400 | 7.90% |
| 5 or more persons | 1,775 | 5.85% |
Income in Northwest Territories
Analyzing income distribution in Northwest Territories can help us better understand its socioeconomic dynamics.
Per Capita Income
According to 2020 data, the median personal income within Northwest Territories is $56,800.
A region's per capita data sheds light on the average income earned per person living in it. Since per capita income is calculated by dividing the region's total income by its population, it quantifies the population's economic situation on an individual basis.
Such data offers insights into the territory's economic performance, spread of income across individuals, quality of life, as well as disparities within its borders.
Most of Northwest Territories population or around 16,890 people falls in the $50,000 to $79,999 group. The next largest groups are the $10,000 to $29,999, and $30,000 to $49,999 with around 15,965 and 14,155 people, respectively.
Household Income
The Northwest Territories's median household income is $127,000, according to 2020 data.
The data provides important insights into the territory's economic landscape as well as the living standards of its population.
Analyzing such data enables researchers, policymakers, and businesses to gain a more comprehensive understanding of the territory's income distribution, disparities, and trends.
Education Levels in Northwest Territories
This data sheds light on the distribution of Northwest Territories residents across educational milestones.
Such information is crucial in shaping the province’s policies on education, workforce development strategies, and initiatives that aim to improve access to quality education and promote lifelong learning opportunities.
53.70% or most of the Northwest Territories population has a Postsecondary certificate, diploma or degree. 24.30% of the population has a Bachelor's degree or higher, 23.20% has a High (secondary) school diploma or equivalency certificate, and 23.15% has No certificate, diploma or degree.
| Degree | Men | Women | Total | Percentage |
|---|---|---|---|---|
| Postsecondary certificate, diploma or degree | 13,835 | 15,355 | 29,185 | 53.70% |
| Bachelor's degree or higher | 5,250 | 7,910 | 13,160 | 24.30% |
| High (secondary) school diploma or equivalency certificate | 6,615 | 6,230 | 12,835 | 23.20% |
| No certificate, diploma or degree | 7,245 | 5,710 | 12,965 | 23.15% |
Employment in Northwest Territories
This dataset provides a snapshot of employment trends in Northwest Territories. It encompasses a wide range of sectors, industries, as well as job categories.
The data shows that the unemployment rate in Newfoundland and Labrador is at 6.11% which is quite high.
| Status | Percentage |
|---|---|
| Employment rate | 64.56% |
| Unemployment rate | 6.11% |
Working as an Employee
The table shows the data on the total number of individuals in the territory who work as an employee. The majority of Northwest Territories's population (around 71.10%) are working permanent position as an employee.
Self-employed
In the territory, there are 945 men and 660 women working as self-employed individuals, bringing the total number to 1,605.
| Status | Men | Women | Total |
|---|---|---|---|
| Self-employed | 945 | 660 | 1,605 |
Employment Industry Sectors
The Northwest Territories industry employment sector census data offers insights into the region's economic landscape. The distribution of employment in Northwest Territories is categorized and quantified, which reveals the region's economic composition.
Northwest Territories has a wide range of industries. Most of its population (27%) works in the public administration sector. The Health care and social assistance sector comes second at 11%, followed by Retail trade at 9%.
| Industry | Men | Women | Percentage |
|---|---|---|---|
| Public administration | 2,880 | 3,310 | 27% |
| Health care and social assistance | 510 | 1,920 | 11% |
| Retail trade | 1,075 | 945 | 9% |
| Educational services | 495 | 1,330 | 8% |
| Construction | 1,200 | 175 | 6% |
| Transportation and warehousing | 1,005 | 320 | 6% |
| Accommodation and food services | 550 | 510 | 5% |
| Mining, quarrying, and oil and gas extraction | 775 | 205 | 4% |
| Professional, scientific and technical services | 560 | 400 | 4% |
| Administrative and support, waste management and remediation services | 500 | 245 | 3% |
| Other services (except public administration) | 390 | 330 | 3% |
| Arts, entertainment and recreation | 195 | 215 | 2% |
| Information and cultural industries | 200 | 155 | 2% |
| Utilities | 245 | 60 | 1% |
| Wholesale trade | 225 | 60 | 1% |
| Finance and insurance | 95 | 185 | 1% |
| Real estate and rental and leasing | 165 | 120 | 1% |
| Manufacturing | 135 | 80 | 1% |
| Agriculture, forestry, fishing and hunting | 140 | 35 | 1% |
| Management of companies and enterprises | 10 | 10 | 0% |
Places of Work
The data offers insights into the commuting patterns as well as workplace distribution in the territory. It provides a snapshot of workplaces, showing their geographic distribution and the flow of workers across different areas.
| Work Location | Men | Women | Total | Percentage |
|---|---|---|---|---|
| Usual place of work | 7,880 | 8,395 | 16,280 | 79.00% |
| No fixed workplace address | 1,735 | 585 | 2,320 | 11.30% |
| Worked at home | 905 | 1,085 | 1,990 | 9.70% |
| Worked outside Canada | 10 | 0 | 10 | 0.00% |
Commuting
The data sheds light on how Northwest Territories residents travel to school or work. It highlights the frequency of different modes of transportation like walking, cycling, carpooling, and public transit.
The data is pivotal in the making of transportation policies as well as the development of transit systems. Ultimately commuting data contributes to improving the quality of life of Northwest Territories residents and sustainable urban planning.
Commuting Duration
This data reveals the average time that the residents of Northwest Territories spend traveling to their workplaces. It also sheds light on the efficiency of the territory's public transit systems, and road networks, as well as the accessibility of the territory.
| Duration | Percentage |
|---|---|
| Less than 15 minutes | 77.40% |
| 15 to 29 minutes | 16.10% |
| 30 to 44 minutes | 2.70% |
| 60 minutes and over | 2.70% |
| 45 to 59 minutes | 1.00% |
Marital Status
The statistics on marital status in Northwest Territoriesshed light on its societal dynamics. It captures the diverse types of marital statuses of the population.
Long-term commitments, such as common-law partnerships, civil unions, and marriages, reflect the territory's social fabric. We can gain insights into Northwest Territories's changing preferences and norms by examining the trends in marital status.
Language Spoken
The data below highlights territory's linguistic diversity, showing elegances of solo language as well as bilingual harmonies. Other than language, it also shows the cultural landscape in Canada.
English is the most spoken official language in Northwest Territories. About 39,055 people living in the province speak English, 1,135 people speak French, 200 people speak Neither English nor French language, and 155 people speak English and French language.
| Language | Population |
|---|---|
| English | 39,055 |
| French | 1,135 |
| Neither English nor French | 200 |
| English and French | 155 |
Religion
Northwest Territories is predominantly Christian. About 22,275 of its population is Christian (10,785 males and 10,785 females).
The second largest religion in the province is Muslim with 1.8% of the population adhering to the religion. There are also Buddhist and Hindu, both represent 0.6% and 0.5% of the population, while Sikh represent 0.3% of the population.
| Religion | Population |
|---|---|
| Christian | 55.2% |
| Islam | 1.8% |
| Buddhist | 0.6% |
| Hindu | 0.5% |
| Sikh | 0.3% |
| Jewish | 0.1% |