About Alberta
Amidst the vastness of Canada’s ten provinces and three territories lies Alberta, a province teeming with natural beauty, economic opportunity, and a dynamic population. With the majestic Rocky Mountains on its western border and sprawling prairies to its east, Alberta’s topography is as diverse as its inhabitants.
One of the most notable aspects of Alberta is its population. With over 4 million residents, it ranks fourth among Canadian provinces in terms of inhabitants. What makes this figure particularly intriguing is its heterogeneity. The province’s residents trace their origins back to every corner of the globe, bringing with them a plethora of cultures, traditions, and languages. This rich tapestry of backgrounds contributes to Alberta’s vibrant cultural landscape.
The very foundation of Alberta’s economy is built upon its abundant natural resources. Historically, oil and gas have been key drivers of the province’s economic growth. The discovery of vast oil reserves in the mid-20th century transformed Alberta into an energy powerhouse. Its contributions to Canada’s GDP are undeniable, but that’s not the only feather in its cap. The province is also a leading producer of beef, and its agricultural industry thrives on the vast expanses of fertile land.
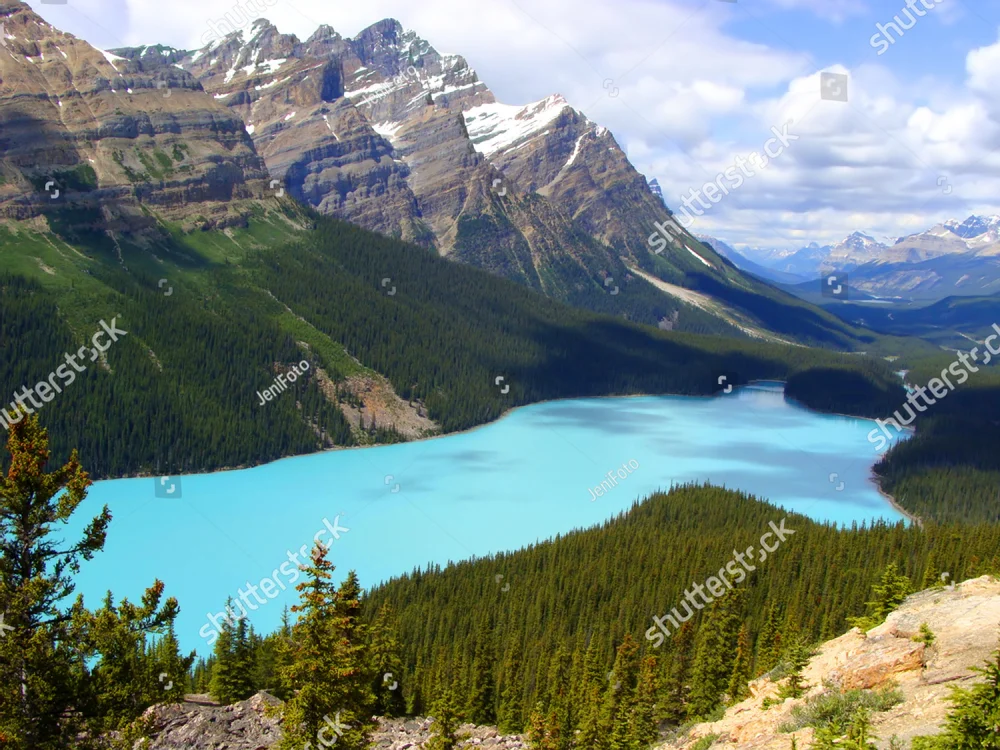
Yet, there’s more to Alberta than its economic metrics and demographics. The province is a treasure trove of natural wonders. The Banff and Jasper national parks, set amidst the backdrop of the Rocky Mountains, offer breathtaking views, hiking trails, and wildlife encounters. In stark contrast, the eastern part of the province boasts the Badlands, a rugged terrain marked by hoodoos and rich in dinosaur fossils.
Education and innovation hold prime spots in Alberta’s societal fabric. Home to renowned institutions such as the University of Alberta and the University of Calgary, the province constantly strives to be at the forefront of research and academic excellence. These hubs of learning, in turn, propel Alberta into a future defined by progressive ideas and sustainable solutions.
However, it’s not just about the tangible assets or numbers. The spirit of Alberta lies in its community’s resilience and innovation. From the early Indigenous communities that thrived here to the modern-day Albertans navigating economic challenges, the province has always been characterized by an indomitable spirit.
In conclusion, Alberta stands as a testament to the balance between natural beauty and human endeavor. Its contrasting landscapes mirror its multifaceted population, and its economic pursuits highlight the province’s role in the broader Canadian narrative. Whether one is drawn to its scenic vistas, its bustling urban centers, or its trailblazing industries, Alberta beckons with a promise of opportunity and discovery.
Photos of Places & Sceneries in Alberta


Population Characteristics
According to the latest census, Alberta has a population of around 4,262,635 people. The province's population is in increased . Between 2016 and 2021, the population of Newfoundland and Labrador has increased by 4.81%.
| Population in 2016 | Population in 2021 | Difference |
|---|---|---|
| 4,067,175 | 4,262,635 | +4.81% |
Population By Genders
The male population of Alberta is around 2,127,935 while the female population is around 2,134,700.
Of the 4,262,635 total population in Alberta, the largest gender is female with around 2,134,700 women within the population.
| Male | Female | Difference |
|---|---|---|
| 2,127,935 | 2,134,700 | +0.32% |
Population by Age Characteristics
Alberta has a young population. The majority of the population is people aged 35 to 39 years old, accounting for 8.00% of the total population. The province median age is 38.40.
| Data | Male | Female | Difference | Total |
|---|---|---|---|---|
| 35 to 39 years | 168,390 7.90% | 170,560 8.00% | 1.27% | 338,945 8.00% |
| 30 to 34 years | 160,175 7.50% | 163,085 7.60% | 1.78% | 323,260 7.60% |
| 40 to 44 years | 153,715 7.20% | 153,955 7.20% | 0.16% | 307,665 7.20% |
| 10 to 14 years | 144,460 6.80% | 136,120 6.40% | 5.77% | 280,585 6.60% |
| 5 to 9 years | 142,850 6.70% | 135,955 6.40% | 4.83% | 278,810 6.50% |
| 45 to 49 years | 139,705 6.60% | 138,065 6.50% | 1.17% | 277,770 6.50% |
| 25 to 29 years | 138,510 6.50% | 136,955 6.40% | 1.12% | 275,465 6.50% |
| 55 to 59 years | 135,825 6.40% | 138,325 6.50% | 1.81% | 274,150 6.40% |
| 60 to 64 years | 131,600 6.20% | 133,640 6.30% | 1.53% | 265,240 6.20% |
| 50 to 54 years | 131,650 6.20% | 131,120 6.10% | 0.40% | 262,770 6.20% |
| 0 to 4 years | 128,560 6.00% | 121,690 5.70% | 5.34% | 250,250 5.90% |
| 15 to 19 years | 128,745 6.10% | 121,015 5.70% | 6.00% | 249,765 5.90% |
| 20 to 24 years | 128,595 6.00% | 120,150 5.60% | 6.57% | 248,740 5.80% |
| 65 to 69 years | 106,975 5.00% | 110,295 5.20% | 3.01% | 217,270 5.10% |
| 70 to 74 years | 79,150 3.70% | 84,735 4.00% | 6.59% | 163,890 3.80% |
| 75 to 79 years | 49,860 2.30% | 55,660 2.60% | 10.42% | 105,520 2.50% |
| 85 years and over | 27,660 1.30% | 44,720 2.10% | 38.15% | 72,375 1.70% |
| 80 to 84 years | 31,510 1.50% | 38,650 1.80% | 18.47% | 70,160 1.60% |
| 85 to 89 years | 18,540 0.90% | 26,130 1.20% | 29.05% | 44,670 1.00% |
| 90 to 94 years | 7,545 0.40% | 13,890 0.70% | 45.68% | 21,430 0.50% |
| 95 to 99 years | 1,405 0.10% | 4,075 0.20% | 65.52% | 5,480 0.10% |
| 100 years and over | 170 0.00% | 625 0.00% | 72.80% | 795 0.00% |
Broader Age Groups
If the province's population is divided into broader age groups, most of the population falls into the 15 to 64 years age group. The group accounts for 66.20% of the population. The other age groups, 0 to 14 years and 65 years and over, account for 19.00% and 14.80%, respectively.
If we look at the population data from the broader age groups, we can see that most people in Alberta are within the 15 to 64 years age group.
| Data | Male | Female | Total |
|---|---|---|---|
| 15 to 64 years | 66.60% | 65.90% | 66.20% |
| Average age of the population | 38.40% | 39.70% | 39.00% |
| Median age of the population | 37.60% | 38.80% | 38.40% |
| 0 to 14 years | 19.50% | 18.40% | 19.00% |
| 65 years and over | 13.90% | 15.60% | 14.80% |
Population of Alberta by Ethnicity and Origin
The population of Alberta is quite diverse, which contributes to the province's vibrant cultural landscape. Alberta is inclusive and accepts various ethnic groups with open arms. Furthermore, the province appreciates the unique contributions that each ethnicity brings.
The top 5 ethnicities and origins in the province are English, which accounts for 18.34% of the total population, followed by German (15.34%), Scottish (15.10%), Irish (13.45%), and Canadian (11.60%).
Other ethnicities and origins in Newfoundland and Labrador include Ukrainian, French, Filipino, Chinese, and Dutch.
| Ethnicity and Origin | Male | Female | Percentage in Population |
|---|---|---|---|
| English | 18.05% | 18.62% | 18.34% |
| German | 15.20% | 15.49% | 15.34% |
| Scottish | 14.84% | 15.37% | 15.10% |
| Irish | 12.95% | 13.95% | 13.45% |
| Canadian | 12.06% | 11.14% | 11.60% |
| Ukrainian | 8.10% | 8.35% | 8.23% |
| French | 8.01% | 8.31% | 8.16% |
| Filipino | 4.50% | 5.26% | 4.88% |
| Chinese | 4.10% | 4.42% | 4.26% |
| Dutch | 4.17% | 4.19% | 4.18% |
Household and Dwelling Characteristics
About 994,565 of Alberta's population live in a single-detached house. In addition, most of them are living in 2 persons household.
Household Size
About 16.90% of the population lives in 2 persons households. 1 person households ranked second, accounting for 13.00% of the population. 3 persons, 4 persons, and 5 or more persons households account for 7.65%, 7.45%, and 5.05%, respectively.
| Number of Person(s) in Household | Total | Percentage |
|---|---|---|
| 2 persons | 551,420 | 16.90% |
| 1 person | 424,055 | 13.00% |
| 3 persons | 249,135 | 7.65% |
| 4 persons | 243,400 | 7.45% |
| 5 or more persons | 165,215 | 5.05% |
Income in Alberta
Analyzing income distribution in Alberta can help us better understand its socioeconomic dynamics.
Per Capita Income
According to 2020 data, the median personal income within Alberta is $44,800.
A region's per capita data sheds light on the average income earned per person living in it. Since per capita income is calculated by dividing the region's total income by its population, it quantifies the population's economic situation on an individual basis.
Such data offers insights into the province's economic performance, spread of income across individuals, quality of life, as well as disparities within its borders.
Most of Alberta population or around 2,139,865 people falls in the $10,000 to $29,999 group. The next largest groups are the $30,000 to $49,999, and $50,000 to $79,999 with around 1,949,255 and 1,908,865 people, respectively.
Household Income
The Alberta's median household income is $96,000, according to 2020 data.
The data provides important insights into the province's economic landscape as well as the living standards of its population.
Analyzing such data enables researchers, policymakers, and businesses to gain a more comprehensive understanding of the province's income distribution, disparities, and trends.
Education Levels in Alberta
This data sheds light on the distribution of Alberta residents across educational milestones.
Such information is crucial in shaping the province’s policies on education, workforce development strategies, and initiatives that aim to improve access to quality education and promote lifelong learning opportunities.
60.25% or most of the Alberta population has a Postsecondary certificate, diploma or degree. 28.35% of the population has a Bachelor's degree or higher, 27.05% has a High (secondary) school diploma or equivalency certificate, and 12.70% has No certificate, diploma or degree.
| Degree | Men | Women | Total | Percentage |
|---|---|---|---|---|
| Postsecondary certificate, diploma or degree | 1,633,810 | 1,734,850 | 3,368,650 | 60.25% |
| Bachelor's degree or higher | 707,965 | 871,445 | 1,579,410 | 28.35% |
| High (secondary) school diploma or equivalency certificate | 781,315 | 772,620 | 1,553,930 | 27.05% |
| No certificate, diploma or degree | 402,515 | 348,195 | 750,715 | 12.70% |
Employment in Alberta
This dataset provides a snapshot of employment trends in Alberta. It encompasses a wide range of sectors, industries, as well as job categories.
The data shows that the unemployment rate in Newfoundland and Labrador is at 7.84% which is quite high.
| Status | Percentage |
|---|---|
| Employment rate | 60.17% |
| Unemployment rate | 7.84% |
Working as an Employee
The table shows the data on the total number of individuals in the province who work as an employee. The majority of Alberta's population (around 68.00%) are working permanent position as an employee.
Self-employed
In the province, there are 213,655 men and 134,320 women working as self-employed individuals, bringing the total number to 347,975.
| Status | Men | Women | Total |
|---|---|---|---|
| Self-employed | 213,655 | 134,320 | 347,975 |
Employment Industry Sectors
The Alberta industry employment sector census data offers insights into the region's economic landscape. The distribution of employment in Alberta is categorized and quantified, which reveals the region's economic composition.
Alberta has a wide range of industries. Most of its population (12%) works in the health care and social assistance sector. The Retail trade sector comes second at 11%, followed by Construction at 9%.
| Industry | Men | Women | Percentage |
|---|---|---|---|
| Health care and social assistance | 51,930 | 233,155 | 12% |
| Retail trade | 117,605 | 135,425 | 11% |
| Construction | 177,845 | 32,505 | 9% |
| Professional, scientific and technical services | 99,055 | 78,840 | 8% |
| Educational services | 43,775 | 105,400 | 7% |
| Accommodation and food services | 57,280 | 75,650 | 6% |
| Transportation and warehousing | 96,000 | 32,410 | 6% |
| Manufacturing | 88,735 | 30,155 | 5% |
| Public administration | 61,230 | 57,040 | 5% |
| Mining, quarrying, and oil and gas extraction | 88,690 | 24,200 | 5% |
| Other services (except public administration) | 50,355 | 54,175 | 5% |
| Administrative and support, waste management and remediation services | 51,325 | 40,430 | 4% |
| Wholesale trade | 50,655 | 20,930 | 3% |
| Finance and insurance | 27,225 | 41,135 | 3% |
| Agriculture, forestry, fishing and hunting | 42,305 | 21,665 | 3% |
| Arts, entertainment and recreation | 20,880 | 21,805 | 2% |
| Real estate and rental and leasing | 21,625 | 17,775 | 2% |
| Information and cultural industries | 16,625 | 12,055 | 1% |
| Utilities | 15,900 | 6,735 | 1% |
| Management of companies and enterprises | 2,075 | 2,345 | 0% |
Places of Work
The data offers insights into the commuting patterns as well as workplace distribution in the province. It provides a snapshot of workplaces, showing their geographic distribution and the flow of workers across different areas.
| Work Location | Men | Women | Total | Percentage |
|---|---|---|---|---|
| Usual place of work | 619,240 | 640,065 | 1,259,305 | 62.00% |
| Worked at home | 211,420 | 234,900 | 446,315 | 22.00% |
| No fixed workplace address | 242,835 | 76,845 | 319,675 | 15.70% |
| Worked outside Canada | 4,105 | 1,330 | 5,430 | 0.30% |
Commuting
The data sheds light on how Alberta residents travel to school or work. It highlights the frequency of different modes of transportation like walking, cycling, carpooling, and public transit.
The data is pivotal in the making of transportation policies as well as the development of transit systems. Ultimately commuting data contributes to improving the quality of life of Alberta residents and sustainable urban planning.
Commuting Duration
This data reveals the average time that the residents of Alberta spend traveling to their workplaces. It also sheds light on the efficiency of the province's public transit systems, and road networks, as well as the accessibility of the province.
| Duration | Percentage |
|---|---|
| 15 to 29 minutes | 38.70% |
| Less than 15 minutes | 30.90% |
| 30 to 44 minutes | 19.20% |
| 60 minutes and over | 5.80% |
| 45 to 59 minutes | 5.50% |
Marital Status
The statistics on marital status in Albertashed light on its societal dynamics. It captures the diverse types of marital statuses of the population.
Long-term commitments, such as common-law partnerships, civil unions, and marriages, reflect the province's social fabric. We can gain insights into Alberta's changing preferences and norms by examining the trends in marital status.
Language Spoken
The data below highlights province's linguistic diversity, showing elegances of solo language as well as bilingual harmonies. Other than language, it also shows the cultural landscape in Canada.
English is the most spoken official language in Alberta. About 4,078,135 people living in the province speak English, 64,440 people speak French, 63,735 people speak Neither English nor French language, and 15,525 people speak English and French language.
| Language | Population |
|---|---|
| English | 4,078,135 |
| French | 64,440 |
| Neither English nor French | 63,735 |
| English and French | 15,525 |
Religion
Alberta is predominantly Christian. About 2,009,820 of its population is Christian (952,440 males and 952,440 females).
The second largest religion in the province is Muslim with 4.8% of the population adhering to the religion. There are also Sikh and Hindu, both represent 2.5% and 1.9% of the population, while Buddhist represent 1.0% of the population.
| Religion | Population |
|---|---|
| Christian | 48.1% |
| Islam | 4.8% |
| Sikh | 2.5% |
| Hindu | 1.9% |
| Buddhist | 1.0% |
| Jewish | 0.3% |