Population Characteristics
According to the latest census, High Level has a population of around 3,922 people. The town's population is in increased . Between 2016 and 2021, the population of High Level has increased by ▲ 24.15%.
| Population in 2016 | Population in 2021 | Difference |
|---|---|---|
| 3,159 | 3,922 | +24.15% |
2026 Population Projection
Based on the compound annual growth rate (CAGR) of 4.42% observed between the 2016 and 2021 censuses, High Level's population is projected to reach approximately 4,869 people by 2026, with a projected population density of around 169.65 people per km².
| Population in 2021 | Projected Population in 2026 | Projected Density in 2026 (per km²) |
|---|---|---|
| 3,922 | 4,869 | 169.65 |
This projection is an estimate calculated by CAPopulation from the compound annual growth rate between the 2016 and 2021 censuses. Official 2026 complete census data expected to be released in late 2027.
High Level Population Trend & Context
High Level is the 62nd-largest town in Alberta, with a 2021 census population of 3,922 — an increase of 763 (▲ 24.15%) people from the 3,159 recorded in 2016.
The town's population has grown steadily over this period, reflecting broader growth trends among Alberta towns. The town's median age of 34.8 years — below the national median of 41.9 — suggests a younger, potentially growing population.
How does High Level compare to other Alberta towns?
- Raymond: 4,199 (2021)
- Vermilion: 3,948 (2021)
- High Level: 3,922 (2021) ← 62nd largest
- Claresholm: 3,804 (2021)
- Cardston: 3,724 (2021)
Population By Genders
The male population of High Level is around 1,945 while the female population is around 1,980.
Of the 3,922 total population in High Level, the largest gender is female with around 1,980 women within the population.
| Male | Female | Difference |
|---|---|---|
| 1,945 | 1,980 | +1.77% |
Is High Level a Good Place to Live?
Based on 2021 Statistics Canada Census data, here's how High Level compares across key quality-of-life indicators — measured against Alberta, its own province. Draw your own conclusions from the actual numbers.
Employment & Economy
Income & Affordability
Commute
Housing Character
Household Composition
Source: Statistics Canada, 2021 Census of Population.
High Level Population Compared to Alberta
Alberta's population in 2021 was 4,262,635, spread across the area. Here's how High Level compares to the town's key indicators:
| Indicator | High Level | Alberta |
|---|---|---|
| Median household income | $104,000 | $96,000 |
| Unemployment rate | 8.8% | 11.5% |
| Median age | 34.8 | 38.4 |
| Bachelor's degree or higher | 22.9% | 28.4% |
| Immigrants (%) | 12.7% | 23.2% |
Population by Age Characteristics
High Level has a young population. The majority of the population is people aged 5 to 9 years old, accounting for 8.50% of the total population. The town median age is 34.80.
| Data | Male | Female | Difference | Total |
|---|---|---|---|---|
| 5 to 9 years | 195 10.00% | 145 7.30% | 25.64% | 335 8.50% |
| 35 to 39 years | 135 6.90% | 175 8.80% | 22.86% | 310 7.90% |
| 10 to 14 years | 150 7.70% | 150 7.60% | 0.00% | 305 7.80% |
| 30 to 34 years | 155 8.00% | 150 7.60% | 3.23% | 300 7.70% |
| 40 to 44 years | 150 7.70% | 140 7.10% | 6.67% | 290 7.40% |
| 0 to 4 years | 150 7.70% | 135 6.80% | 10.00% | 285 7.30% |
| 25 to 29 years | 140 7.20% | 135 6.80% | 3.57% | 275 7.00% |
| 20 to 24 years | 135 6.90% | 125 6.30% | 7.41% | 260 6.60% |
| 15 to 19 years | 115 5.90% | 100 5.10% | 13.04% | 220 5.60% |
| 45 to 49 years | 110 5.70% | 110 5.60% | 0.00% | 220 5.60% |
| 50 to 54 years | 100 5.10% | 105 5.30% | 4.76% | 205 5.20% |
| 55 to 59 years | 100 5.10% | 110 5.60% | 9.09% | 205 5.20% |
| 60 to 64 years | 125 6.40% | 80 4.00% | 36.00% | 200 5.10% |
| 65 to 69 years | 55 2.80% | 115 5.80% | 52.17% | 170 4.30% |
| 85 years and over | 10 0.50% | 95 4.80% | 89.47% | 100 2.60% |
| 70 to 74 years | 55 2.80% | 35 1.80% | 36.36% | 85 2.20% |
| 80 to 84 years | 10 0.50% | 70 3.50% | 85.71% | 85 2.20% |
| 75 to 79 years | 55 2.80% | 10 0.50% | 81.82% | 65 1.70% |
| 85 to 89 years | 10 0.50% | 30 1.50% | 66.67% | 40 1.00% |
| Average age of the population | 34 34.40% | 38 38.30% | 10.44% | 36 36.40% |
| 95 to 99 years | 0 0.00% | 35 1.80% | 100.00% | 35 0.90% |
Broader Age Groups
If the town's population is divided into broader age groups, most of the population falls into the 15 to 64 years age group. The group accounts for 63.50% of the population. The other age groups, 0 to 14 years and 65 years and over, account for 23.60% and 12.90%, respectively.
If we look at the population data from the broader age groups, we can see that most people in High Level are within the 15 to 64 years age group.
| Data | Male | Female | Total |
|---|---|---|---|
| Median age of the population | 32.80% | 36.00% | 34.80% |
| 0 to 14 years | 25.40% | 22.00% | 23.60% |
| 65 years and over | 9.50% | 16.20% | 12.90% |
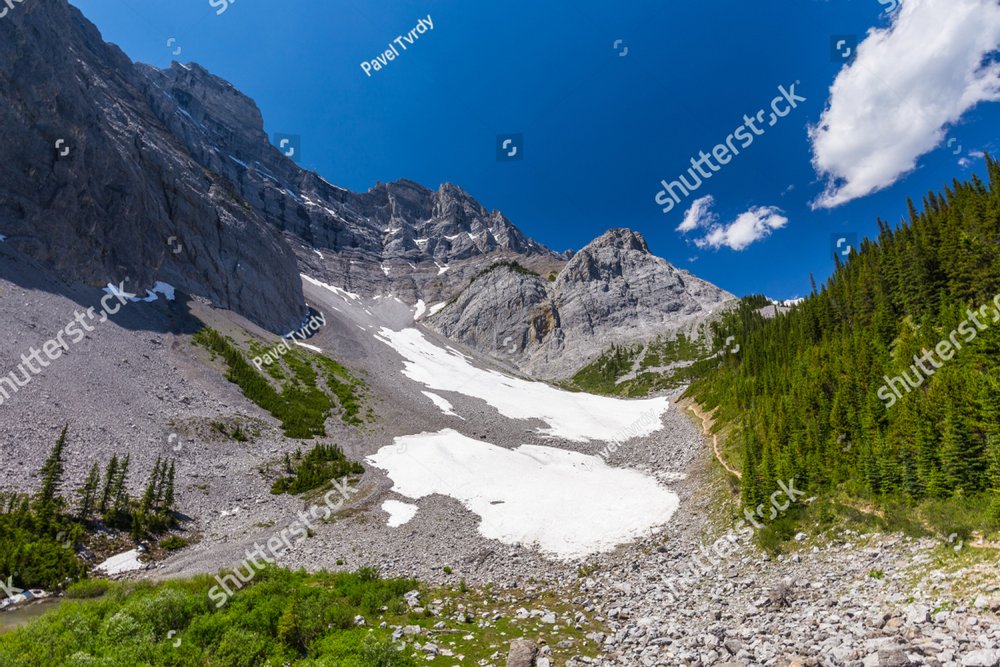
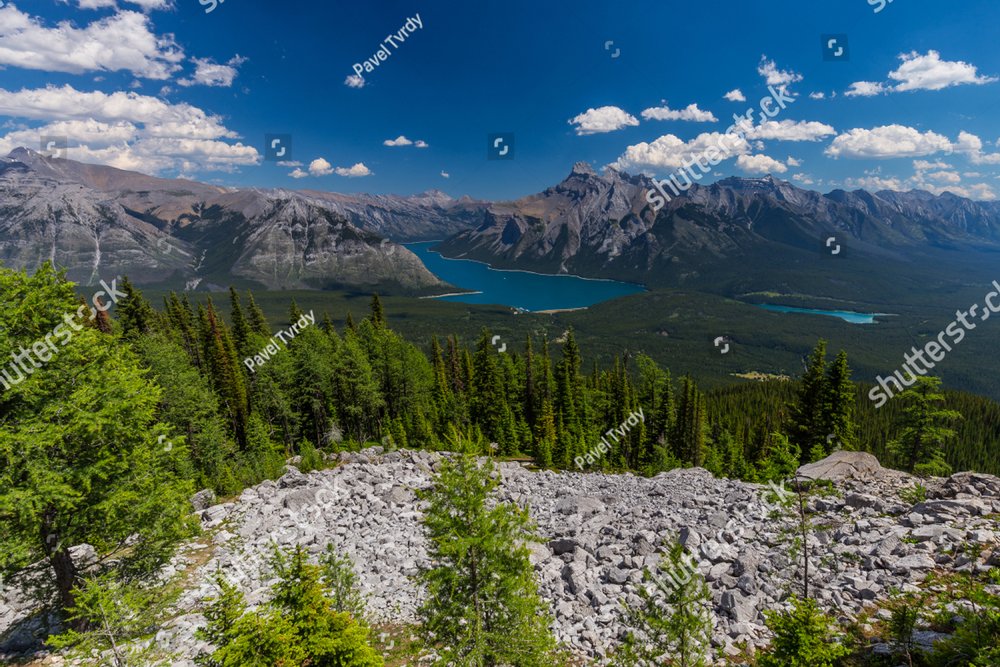
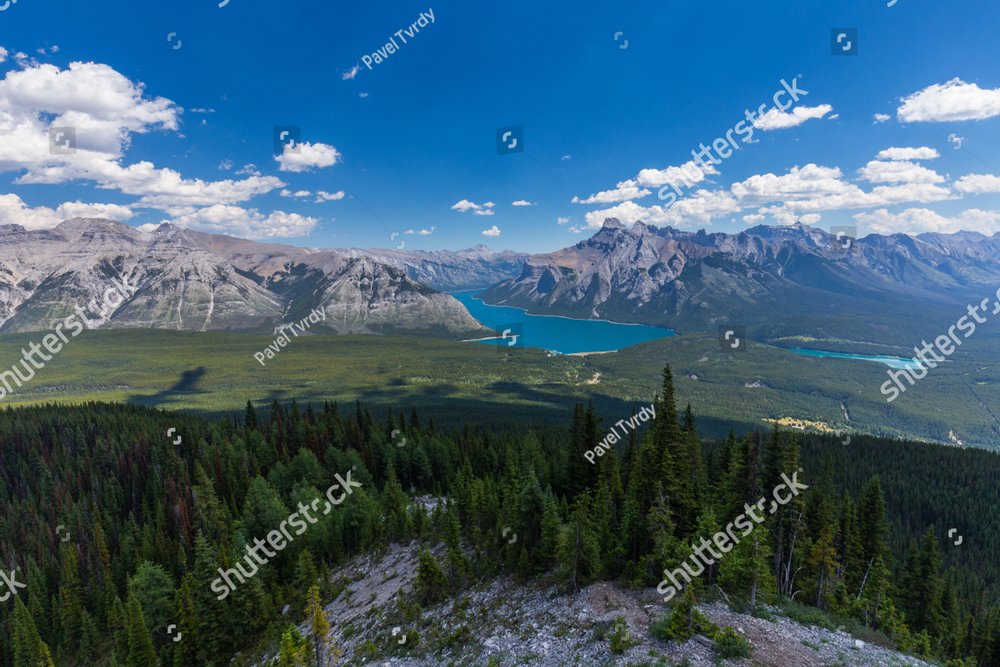
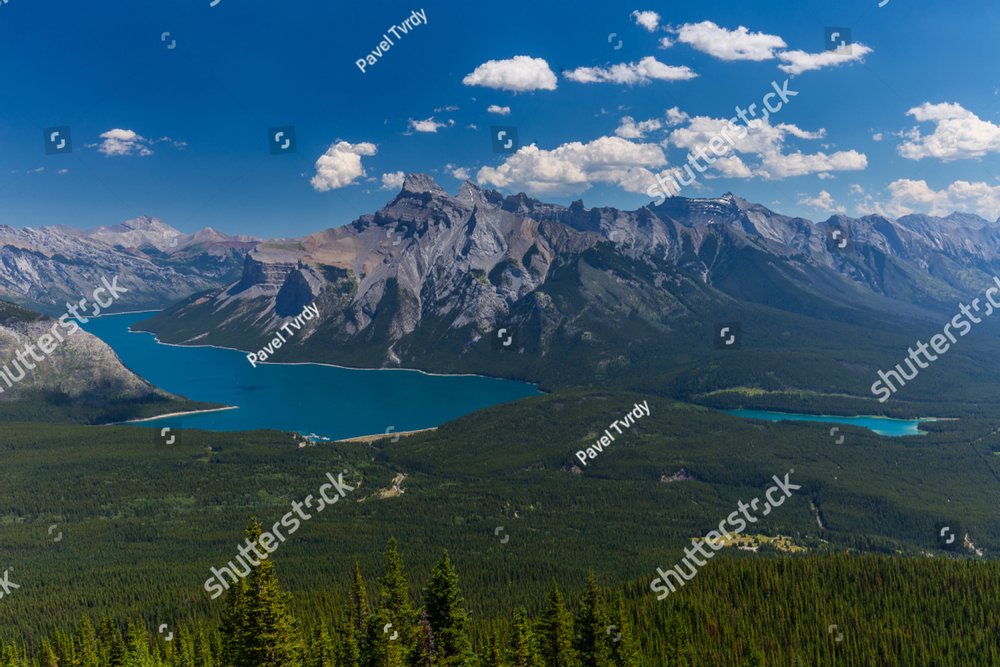
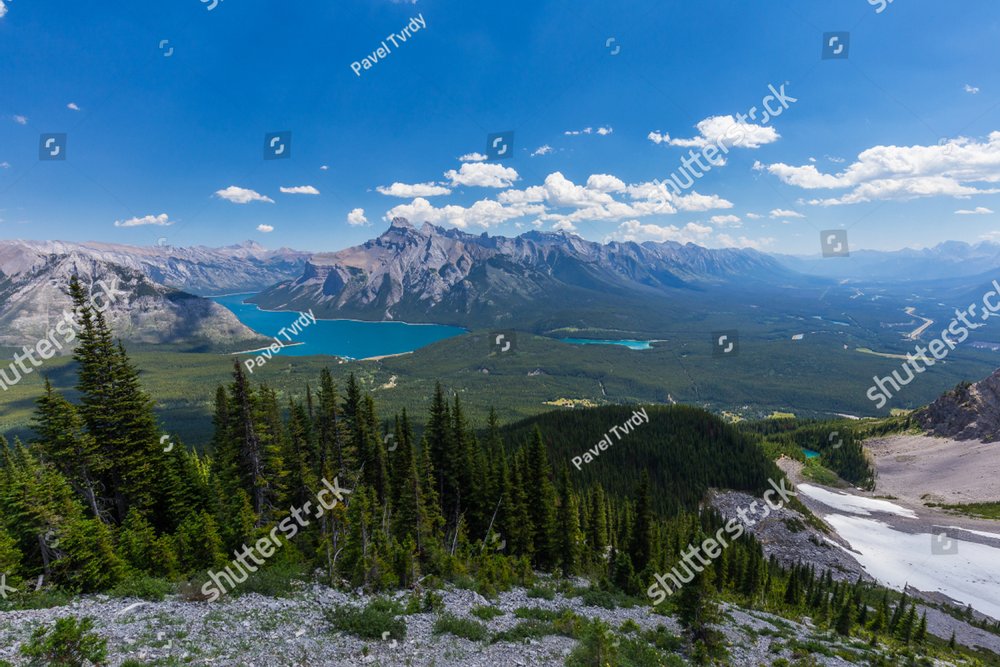
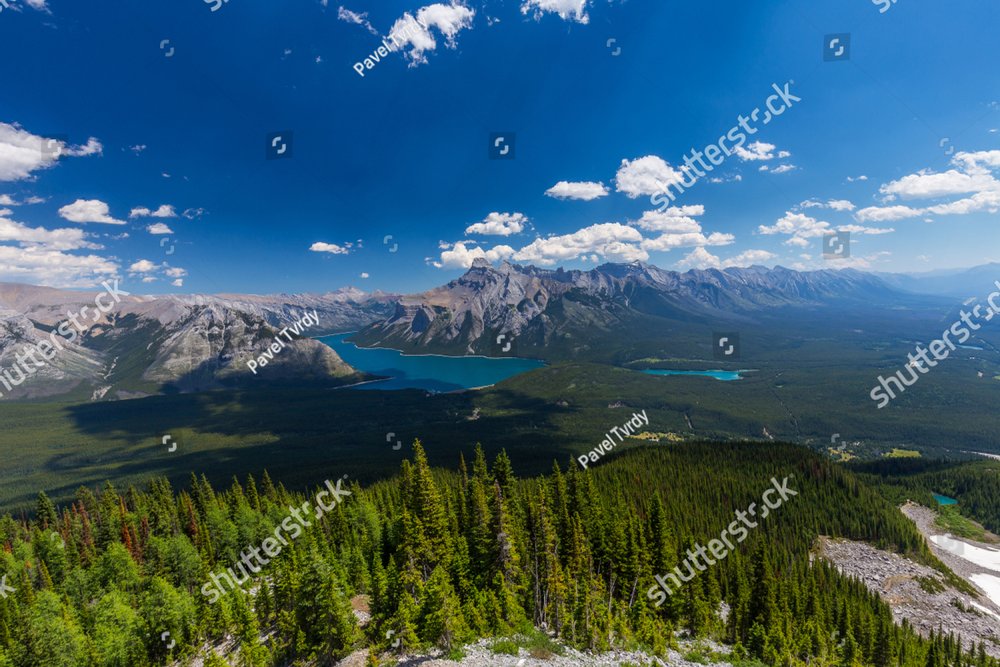
Photos of Places & Sceneries in High Level
Population of High Level by Ethnicity and Origin
The population of High Level is quite diverse, which contributes to the town's vibrant cultural landscape. High Level is inclusive and accepts various ethnic groups with open arms. Furthermore, the town appreciates the unique contributions that each ethnicity brings.
The top 5 ethnicities and origins in High Level are Irish, which accounts for 15.49% of the total population, followed by English (14.23%), Scottish (11.83%), Canadian (11.55%), and German (9.58%).
Other ethnicities and origins in High Level include North American Indigenous, First Nations (North American Indian), French, Filipino, and Cree.
| Ethnicity and Origin | Male | Female | Percentage in Population |
|---|---|---|---|
| Irish | 17.04% | 13.92% | 15.49% |
| English | 14.25% | 14.20% | 14.23% |
| Scottish | 12.57% | 11.08% | 11.83% |
| Canadian | 12.57% | 10.51% | 11.55% |
| German | 9.22% | 10.23% | 9.58% |
| North American Indigenous | 10.34% | 8.81% | 9.58% |
| First Nations (North American Indian) | 10.06% | 7.95% | 9.01% |
| French | 8.38% | 8.52% | 8.45% |
| Filipino | 7.26% | 9.66% | 8.45% |
| Cree | 7.82% | 7.95% | 7.75% |
Immigration Profile
Immigration patterns vary a great deal from one area to another, which makes this data one of the more distinctive parts of High Level's population profile.
About 12.7% of High Level's population are immigrants (450 people).
The top countries of origin for High Level's immigrant population are Philippines (235), Mexico (35), United States of America (35), India (30), Nigeria (20).
| Country of Birth | Population |
|---|---|
| Philippines | 235 |
| Mexico | 35 |
| United States of America | 35 |
| India | 30 |
| Nigeria | 20 |
Household and Dwelling Characteristics
About 630 of High Level's population live in a single-detached house. In addition, most of them are living in 2 persons household.
Household Size
About 14.70% of the population lives in 2 persons households. 1 person households ranked second, accounting for 13.15% of the population. 4 persons, 3 persons, and 5 or more persons households account for 8.00%, 7.80%, and 6.70%, respectively.
| Number of Person(s) in Household | Total | Percentage |
|---|---|---|
| 2 persons | 385 | 14.70% |
| 1 person | 345 | 13.15% |
| 4 persons | 210 | 8.00% |
| 3 persons | 205 | 7.80% |
| 5 or more persons | 175 | 6.70% |
Income in High Level
Analyzing income distribution in High Level can help us better understand its socioeconomic dynamics.
Per Capita Income
According to 2020 data, the median personal income within High Level is $52,400.
A region's per capita data sheds light on the average income earned per person living in it. Since per capita income is calculated by dividing the region's total income by its population, it quantifies the population's economic situation on an individual basis.
Such data offers insights into the town's economic performance, spread of income across individuals, quality of life, as well as disparities within its borders.
Most of High Level population or around 425 people falls in the $50,000 to $79,999 group. The next largest groups are the $100,000 to $149,999, and $30,000 to $49,999 with around 380 and 360 people, respectively.
Household Income
The High Level's median household income is $104,000, according to 2020 data.
Above national average High Level's median household income is 20,000 dollars above the Canadian national median of $84,000 (2020 data, 2021 Census).
The data provides important insights into the town's economic landscape as well as the living standards of its population.
Analyzing such data enables researchers, policymakers, and businesses to gain a more comprehensive understanding of the town's income distribution, disparities, and trends.
Education Levels in High Level
This data sheds light on the distribution of High Level residents across educational milestones.
Such information is crucial in shaping the province’s policies on education, workforce development strategies, and initiatives that aim to improve access to quality education and promote lifelong learning opportunities.
51.55% or most of the High Level population has a Postsecondary certificate, diploma or degree. 32.45% of the population has a High (secondary) school diploma or equivalency certificate, 22.85% has a Bachelor's degree or higher, and 16.15% has No certificate, diploma or degree.
| Degree | Men | Women | Total | Percentage |
|---|---|---|---|---|
| Postsecondary certificate, diploma or degree | 1,010 | 1,285 | 2,295 | 51.55% |
| High (secondary) school diploma or equivalency certificate | 750 | 720 | 1,465 | 32.45% |
| Bachelor's degree or higher | 370 | 645 | 1,015 | 22.85% |
| No certificate, diploma or degree | 390 | 355 | 740 | 16.15% |
Below national average 22.9% of High Level's population has a bachelor's degree or higher, compared to the national average of 32.9% (Canada, 2021 Census).
Employment in High Level
This dataset provides a snapshot of employment trends in High Level. It encompasses a wide range of sectors, industries, as well as job categories.
The data shows that the unemployment rate in High Level is at 6.93% which is quite high.
| Status | Percentage |
|---|---|
| Employment rate | 71.88% |
| Unemployment rate | 6.93% |
Working as an Employee
The table shows the data on the total number of individuals in the town who work as an employee. The majority of High Level's population (around 81.90%) are working permanent position as an employee.
Self-employed
In the town, there are 75 men and 40 women working as self-employed individuals, bringing the total number to 110.
| Status | Men | Women | Total |
|---|---|---|---|
| Self-employed | 75 | 40 | 110 |
Employment Industry Sectors
The High Level industry employment sector census data offers insights into the region's economic landscape. The distribution of employment in High Level is categorized and quantified, which reveals the region's economic composition.
High Level has a wide range of industries. Most of its population (18%) works in the manufacturing sector. The Retail trade sector comes second at 15%, followed by Health care and social assistance at 14%.
| Industry | Men | Women | Percentage |
|---|---|---|---|
| Manufacturing | 305 | 70 | 18% |
| Retail trade | 110 | 175 | 15% |
| Health care and social assistance | 70 | 200 | 14% |
| Educational services | 60 | 175 | 12% |
| Public administration | 55 | 85 | 7% |
| Accommodation and food services | 60 | 75 | 7% |
| Construction | 85 | 20 | 5% |
| Transportation and warehousing | 55 | 30 | 4% |
| Other services (except public administration) | 45 | 25 | 4% |
| Mining, quarrying, and oil and gas extraction | 40 | 0 | 2% |
| Agriculture, forestry, fishing and hunting | 25 | 15 | 2% |
| Finance and insurance | 0 | 30 | 2% |
| Professional, scientific and technical services | 10 | 25 | 2% |
| Real estate and rental and leasing | 15 | 10 | 1% |
| Wholesale trade | 20 | 0 | 1% |
| Information and cultural industries | 15 | 10 | 1% |
| Administrative and support, waste management and remediation services | 15 | 10 | 1% |
| Utilities | 10 | 0 | 1% |
| Arts, entertainment and recreation | 10 | 0 | 1% |
| Management of companies and enterprises | 0 | 0 | 0% |
Labour Market Snapshot
A quick snapshot of where High Level residents work — the leading industry sectors employing them, and the broad occupation categories they work in.
Top employer sectors in High Level: -33 Manufacturing (18%), -45 Retail trade (15%), Health care and social assistance (14%)
Top occupation categories in High Level: Sales and service occupations (24%), Trades, transport and equipment operators and related occupations (19%), Occupations in education, law and social, community and government services (17%)
Places of Work
The data offers insights into the commuting patterns as well as workplace distribution in the town. It provides a snapshot of workplaces, showing their geographic distribution and the flow of workers across different areas.
| Work Location | Men | Women | Total | Percentage |
|---|---|---|---|---|
| Usual place of work | 760 | 780 | 1,540 | 84.80% |
| Worked at home | 65 | 85 | 150 | 8.30% |
| No fixed workplace address | 95 | 30 | 130 | 7.20% |
| Worked outside Canada | 0 | 0 | 0 | 0.00% |
Commuting
The data sheds light on how High Level residents travel to school or work. It highlights the frequency of different modes of transportation like walking, cycling, carpooling, and public transit.
The data is pivotal in the making of transportation policies as well as the development of transit systems. Ultimately commuting data contributes to improving the quality of life of High Level residents and sustainable urban planning.
Commuting Duration
This data reveals the average time that the residents of High Level spend traveling to their workplaces. It also sheds light on the efficiency of the town's public transit systems, and road networks, as well as the accessibility of the town.
| Duration | Percentage |
|---|---|
| Less than 15 minutes | 82.90% |
| 15 to 29 minutes | 13.20% |
| 60 minutes and over | 2.10% |
| 30 to 44 minutes | 1.50% |
| 45 to 59 minutes | 0.90% |
Marital Status
The statistics on marital status in High Levelshed light on its societal dynamics. It captures the diverse types of marital statuses of the population.
Long-term commitments, such as common-law partnerships, civil unions, and marriages, reflect the town's social fabric. We can gain insights into High Level's changing preferences and norms by examining the trends in marital status.
Language Spoken
The data below highlights town's linguistic diversity, showing elegances of solo language as well as bilingual harmonies. Other than language, it also shows the cultural landscape in Canada.
English is the most spoken official language in High Level. About 3,565 people living in the province speak English, 30 people speak French, 10 people speak Neither English nor French language, and 0 people speak English and French language.
| Language | Population |
|---|---|
| English | 3,565 |
| French | 30 |
| Neither English nor French | 10 |
| English and French | 0 |
Mother Tongue & Home Language
Useful for newcomers researching an area: this shows the language residents first learned at home in childhood (mother tongue) and the language they speak most often at home now, which can differ as families settle in.
| Language | Mother Tongue | Spoken Most Often at Home |
|---|---|---|
| English | 76.7% | 86.9% |
| Non-official languages | 17.2% | 8.9% |
| French | 1.0% | 0.0% |
Religion
High Level is predominantly Christian. About 1,750 of its population is Christian (805 males and 805 females).
The second largest religion in the province is Hindu with 0.6% of the population adhering to the religion. There are also Buddhist and Jewish, both represent 0.4% and 0.0% of the population, while Muslim represent 0.0% of the population.
| Religion | Population |
|---|---|
| Christian | 49.3% |
| Hindu | 0.6% |
| Buddhist | 0.4% |
| Jewish | 0.0% |
| Islam | 0.0% |
| Sikh | 0.0% |
Points of Interest in High Level
Hospitals
Schools
Parks
- Canfor Park
- Centennial Park
- Jubilee Park
- Top of sliding hill
- 103st Playground
- Picnic area
- Dragonfly Park
- Tombri Playground
- Bjornson Park
Libraries
Places to Visit in High Level
Historic Sites
Green Spaces in High Level
| Name | Type | Approx. Area |
|---|---|---|
| Canfor Park | Parks | 1.3 ha |
| Centennial Park | Parks | 1.8 ha |
| Jubilee Park | Parks | 1.4 ha |
| Top of sliding hill | Parks | 0.0 ha |
| 103st Playground | Parks | 0.7 ha |
| Picnic area | Parks | 1.3 ha |
| Dragonfly Park | Parks | 0.2 ha |
| Tombri Playground | Parks | 0.1 ha |
| Bjornson Park | Parks | 0.1 ha |
Areas are approximate, calculated from OpenStreetMap boundary data.
Other Towns in Alberta
- Cochrane 32,199
- Okotoks 30,405
- Stony Plain 17,993
- Sylvan Lake 15,995
- Canmore 15,990
- Strathmore 14,339
- High River 14,324
- Blackfalds 10,470
- Morinville 10,385
- Whitecourt 9,927
- Hinton 9,817
- Olds 9,209
- Coaldale 8,771
- Edson 8,374
- Banff 8,305
- Innisfail 7,985
- Drumheller 7,909
- Ponoka 7,331
- Drayton Valley 7,291
- Slave Lake 6,836
- Rocky Mountain House 6,765
- Peace River 6,619
- Wainwright 6,606
- Devon 6,545
- Bonnyville 6,404
- St. Paul 5,863
- Stettler 5,695
- Vegreville 5,689
- Redcliff 5,581
- Didsbury 5,070
- Westlock 4,921
- Carstairs 4,898
- Barrhead 4,320
- Raymond 4,199
- Vermilion 3,948
- Claresholm 3,804
- Cardston 3,724
- Pincher Creek 3,622
- Crossfield 3,599
- Penhold 3,484
- Fort Macleod 3,297
- Gibbons 3,218
- Three Hills 3,042
- Coalhurst 2,869
- Fairview 2,817
- Athabasca 2,759
- Black Diamond 2,730
- Sundre 2,672
- Turner Valley 2,611
- Grimshaw 2,601
- Magrath 2,481
- Rimbey 2,470
- Sexsmith 2,427
- Hanna 2,394
- High Prairie 2,380
- Beaverlodge 2,271
- Calmar 2,183
- Nanton 2,167
- Redwater 2,115
- Tofield 2,045
- Bow Island 2,036
- Picture Butte 1,930
- Provost 1,900
- Millet 1,890
- Vulcan 1,769
- Lamont 1,744
- Valleyview 1,673
- Fox Creek 1,639
- Bon Accord 1,461
- Nobleford 1,438
- Wembley 1,432
- Two Hills 1,416
- Elk Point 1,399
- Bruderheim 1,329
- Vauxhall 1,286
- Bowden 1,280
- Mayerthorpe 1,259
- Legal 1,232
- Swan Hills 1,201
- Irricana 1,179
- Smoky Lake 1,127
- Manning 1,126
- Bentley 1,042
- Eckville 1,014
- Falher 1,001
- Trochu 998
- Viking 986
- Thorsby 967
- Onoway 966
- Killam 918
- Oyen 917
- Coronation 868
- Spirit River 849
- Bashaw 848
- Milk River 824
- Castor 803
- Daysland 789
- Sedgewick 761
- McLennan 695
- Mundare 689
- Hardisty 548
- Stavely 544
- Rainbow Lake 495
Frequently Asked Questions about High Level
According to the 2021 Statistics Canada Census, High Level has a population of 3,922 people, making it the 62nd town in Alberta. The population increased significantly from 3,159 in 2016, an increase of 763 people or 24.15%. The town has a population density of 136.7 people per km² across a land area of 28.70 km². The 2026 Census results are expected from Statistics Canada beginning February 2027.
High Level's population grew by 24.15% between the 2016 and 2021 censuses — from 3,159 to 3,922 people, a gain of 763 residents. This growth is above average compared to many other Alberta towns during this period. The median age of 34.80 years suggests a comparatively young population. Official 2026 Census data, which will confirm whether this trend continued, is expected from Statistics Canada in February 2027.
High Level has a population density of approximately 136.70 people per square kilometre.
High Level covers a land area of approximately 28.70 km².
The median age of the population in High Level is 34.80 years.
The largest ethnic or cultural origin group in High Level is Irish.
The median household income in High Level is $104,000, based on 2020 data.
English is the most common first official language spoken in High Level.
Christian is the predominant religion in High Level.
Statistics Canada (statcan.gc.ca) conducted the 2026 Census of Population in May 2026. However, census data goes through an extensive processing, validation, and quality-assurance period before public release. Based on the release plan, the 2026 Census results begin rolling out on February 10, 2027, with complete community-level profiles available by December 1, 2027. Until then, this page uses 2021 Census data as its primary source, supplemented by a population projection estimate for 2026 calculated using the compound annual growth rate (CAGR) from the 2016–2021 Census period.